Download
1 / 17
170 likes | 249 Views
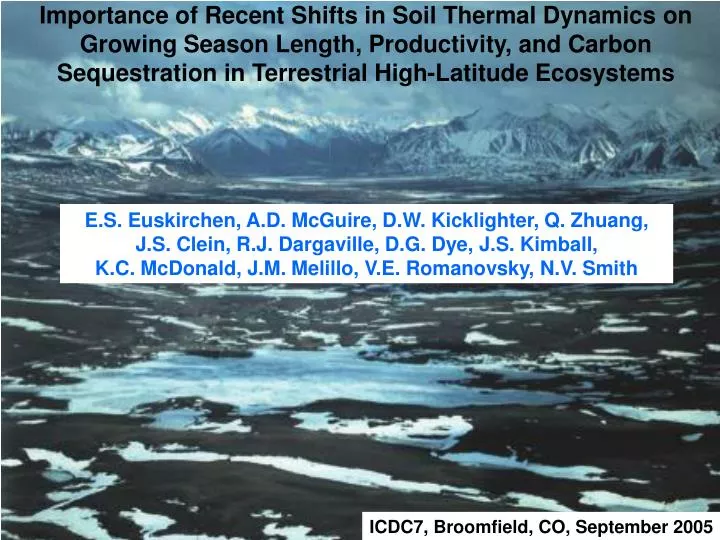
Importance of Recent Shifts in Soil Thermal Dynamics on Growing Season Length, Productivity, and Carbon Sequestration in Terrestrial High-Latitude Ecosystems. E.S. Euskirchen, A.D. McGuire, D.W. Kicklighter, Q. Zhuang, J.S. Clein, R.J. Dargaville, D.G. Dye, J.S. Kimball,

E N D
Importance of Recent Shifts in Soil Thermal Dynamics on Growing Season Length, Productivity, and Carbon Sequestration in Terrestrial High-Latitude Ecosystems E.S. Euskirchen, A.D. McGuire, D.W. Kicklighter, Q. Zhuang, J.S. Clein, R.J. Dargaville, D.G. Dye, J.S. Kimball, K.C. McDonald, J.M. Melillo, V.E. Romanovsky, N.V. Smith ICDC7, Broomfield, CO, September 2005
High Latitude Temperature Trends (1966-1995) Annual data (Serreze et al., Climatic Change, 2000) °C per decade
Spring: beginning of the growing season: Increasing temperature and light availability The snow melts Thawing of soil organic horizons Onset of photosynthesis Fall: end of growing season: Temperatures and light availability decrease Soils re-freeze Photosynthesis slows or ceases
Net ecosystem productivity could increase or decrease in response to changes in soil freeze-thaw regimes. Increases would be due to a longer growing season. However, enhanced productivity could be counter-balanced by increases in respiration from the soil heterotrophs.
Pan-Arctic Growing Season Change Change in Day of Thaw (Days/Year) -3 -2 -1 0 1 2 3 Earlier thaw Later thaw The recent availability of remotely sensed spatially explicit data from high-latitudes provides an opportunity to evaluate if a large-scale process-based model captures changes in snow cover, soil freeze-thaw regimes, and growing season length. Satellite detection of recent changes in timing of pan-arctic spring thaw (K.C McDonald et al., Earth Interactions, 2004)
What are the implications of recent observed changes in snow cover, soil freeze-thaw regimes, and the timing and length of the growing season on terrestrial carbon dynamics, both retrospectively (1960-2000) and prognostically (2001 –2100)?
Terrestrial Ecosystem Model couples biogeochemistry & soil thermal dynamics Upper Boundary Conditions RA RH Soil Temps. at Different Depths Heat balance surface Prescribed Temperature Snow Cover LC Heat Conduction Snow Depth Moss Depth Organic Soil Depth Mineral Soil Depth Moss & litter Heat Conduction Frozen Ground Organic Soil Moving phase plane Thawed Ground LN Moving phase plane Mineral Soil Prescribed Temperature Frozen Ground Lower boundary Lower Boundary Conditions Soil temperature Vegetation type; Snow pack; Soil moisture Soil Thermal Model (STM) Terrestrial Ecosystem Model (TEM)
TEM Simulations & Model Validation -Conducted simulations focusing on terrestrial land areas above 30º N and retrospective decadal trends from the 1960s –2000 -Also conducted prognostic simulations focusing on 2001-2100 using interpolated climate data obtained from a two dimensional climate model (Sokolov and Stone, 1998) -Performed simulations with transient CO2 and climate data -Validated the TEM results with several remotely sensed datasets (Dye, 2002; McDonald et al., 2004; Smith et al., 2004)
8.0 –18.0 Weeks–Region 1 18.0 – 28.0 Weeks – Region 2 28.0 –37.0 Weeks – Region 3 Duration of Snow Free Period 1972-2000 4 Region 1 2 0 -2 -4 Region 2 1 Snow Free Duration Anomaly (weeks) -1 D. Dye = White lines TEM = Colored lines -3 3 Region 3 1 Based on simulation of the TEM for north of 30o N -1 -3 1972 1980 1990 2000
8.0 –18.0 Weeks–Region 1 18.0 – 28.0 Weeks – Region 2 28.0 –37.0 Weeks – Region 3 Duration of Snow Free Period 1972-2000 *D. Dye, Hydrological Processes, 2002
2001-2100 1960-2000 Longer GSL Shorter GSL <-2 -1 -0.5 0 0.25 0.5 1 2 >3 Growing season length (GSL) change (days per year) (1) Earth Interactions, 2004 (2) Journal of Geophysical Research, 2004
18.3 g C m-2 yr-1 day-1 9.1 g C m-2 yr-1 day-1 Net primary productivity 550 75 0 150 0 250 8.8 g C m-2 yr-1 day-1 3.8 g C m-2 yr-1 day-1 0 -550 Heterotrophic respiration -75 -150 0 -250 1960-2000 2001-2100 Anomaly (g C m-2 yr-1) -30 -20 -10 0 10 20 -8 -6 -4 -2 0 2 4 6 8 Growing season length anomaly (days) [R2] = 0.40-0.87 [p] < 0.0001
5.3 g C m-2 yr-1 day-1 75 300 1000 0 300 0 0 -75 75 0 -300 -1000 -30 -20 -10 0 10 20 0 -300 -75 100 0 -100 -8 -6 -4 -2 0 2 4 6 8 [R2] = 0.30-0.88 [p] < 0.0001 1960-2000 2001-2100 9.5 g C m-2 yr-1 day-1 Net ecosystem productivity -8.1 g C m-2 40 yr-1 22.2 g C m-2 100 yr-1 Soil C Anomaly (g C m-2 yr-1) -13.2 g C m-2 100 yr-1 8.9 g C m-2 40 yr-1 33.8 g C m-2 100 yr-1 Vegetation C Growing season length anomaly (days)
Trends in growing season length, productivity and respiration 8.0 –18.0 Weeks–Region 1 18.0 – 28.0 Weeks – Region 2 28.0 –37.0 Weeks – Region 3 Greatest increases in GSL. Smallest increases in productivity and respiration Similar increases in GSL to Region 3. Intermediate increases in productivity and respiration. Similar increases in GSL to Region 2. Greatest overall increases in productivity and respiration Duration of snow-free period
2000 2010 2020 2030 2040 2050 2060 2070 2080 2090 - 1.5 (d) (c) 2000 2010 1960 2020 2030 1970 2040 2050 1 2060 2070 1980 2080 2090 1990 0.5 0 - 0.5 - 1 Jan Feb Mar Apr May Jun Jul Aug Sep Oct Nov Dec Jan Feb Mar Apr May Jun Jul Aug Sep Oct Nov Dec 2001-2100 1960-2000 4 (a) (b) 3 Sink 2 Temperate regions (30 – 60° N) 1 0 1960 - 1 1970 Source 1980 - 2 Cumulative NEP (Pg C region-1) 1990 - 3 Sink Boreal & tundra regions (60 – 90° N) Source J F M A M J J A S O N D J F M A M J J A S O N D Month
Conclusions Model simulations indicate strong connections between decreases in snow cover and changes in growing season length. These dynamics substantially influence carbon fluxes, including enhanced respiration and productivity in our analyses. Increases in productivity and respiration at high latitudes are not as large as those in lower latitudes. It is important to improve our understanding of the relative responses of photosynthesis and respiration to changes in atmospheric CO2 and climate.
Acknowledgements Funds were provided by: The NSF for the Arctic Biota/Vegetation portion of the Climate of the Arctic: Modeling and Processes project within International Arctic Research Center at the University of Alaska Fairbanks The USGS ‘Fate of Carbon in Alaska Landscapes’ project