Download

1 / 41
410 likes | 419 Views
Obesity in America. Definitions. Obesity: Having a very high amount of body fat in relation to lean body mass, or Body Mass Index (BMI) of 30 or higher.

E N D
Definitions • Obesity: Having a very high amount of body fat in relation to lean body mass, or Body Mass Index (BMI) of 30 or higher. • Body Mass Index (BMI): A measure of an adult’s weight in relation to his or her height, specifically the adult’s weight in kilograms divided by the square of his or her height in meters.
Overweight or Obese? • For adults, overweight and obesity ranges are determined by using weight and height to calculate a number called the ‘body mass index’ (BMI). BMI is used because, for most people, it correlates with their amount of body fat. • An adult who has a BMI between 25 and 29.9 is considered overweight • An adult who has a BMI of 30 or higher is considered obese.
Overweight or Underweight? • Example: If you are an adult (20 or older) who is 5 ft. 9 inches tall …
Defining Healthy Body Weight for Teens • Classifications of overweight and obesity for children and adolescents are age- and sex-specific because children’s body composition varies as they age and varies between boys and girls. • To find out if your weight is healthy for a teenager (19 or under) go to this website: http://apps.nccd.cdc.gov/dnpabmi/
Obesity Trends* Among U.S. AdultsBRFSS, 1985 (*BMI ≥30, or ~ 30 lbs. overweight for 5’ 4” person) No Data <10% 10%–14%
Obesity Trends* Among U.S. AdultsBRFSS, 1986 (*BMI ≥30, or ~ 30 lbs. overweight for 5’ 4” person) No Data <10% 10%–14%
Obesity Trends* Among U.S. AdultsBRFSS, 1987 (*BMI ≥30, or ~ 30 lbs. overweight for 5’ 4” person) No Data <10% 10%–14%
Obesity Trends* Among U.S. AdultsBRFSS, 1988 (*BMI ≥30, or ~ 30 lbs. overweight for 5’ 4” person) No Data <10% 10%–14%
Obesity Trends* Among U.S. AdultsBRFSS, 1989 (*BMI ≥30, or ~ 30 lbs. overweight for 5’ 4” person) No Data <10% 10%–14%
Obesity Trends* Among U.S. AdultsBRFSS, 1990 (*BMI ≥30, or ~ 30 lbs. overweight for 5’ 4” person) No Data <10% 10%–14%
Obesity Trends* Among U.S. AdultsBRFSS, 1991 (*BMI ≥30, or ~ 30 lbs. overweight for 5’ 4” person) No Data <10% 10%–14% 15%–19%
Obesity Trends* Among U.S. AdultsBRFSS, 1992 (*BMI ≥30, or ~ 30 lbs. overweight for 5’ 4” person) No Data <10% 10%–14% 15%–19%
Obesity Trends* Among U.S. AdultsBRFSS, 1993 (*BMI ≥30, or ~ 30 lbs. overweight for 5’ 4” person) No Data <10% 10%–14% 15%–19%
Obesity Trends* Among U.S. AdultsBRFSS, 1994 (*BMI ≥30, or ~ 30 lbs. overweight for 5’ 4” person) No Data <10% 10%–14% 15%–19%
Obesity Trends* Among U.S. AdultsBRFSS, 1995 (*BMI ≥30, or ~ 30 lbs. overweight for 5’ 4” person) No Data <10% 10%–14% 15%–19%
Obesity Trends* Among U.S. AdultsBRFSS, 1996 (*BMI ≥30, or ~ 30 lbs. overweight for 5’ 4” person) No Data <10% 10%–14% 15%–19%
Obesity Trends* Among U.S. AdultsBRFSS, 1997 (*BMI ≥30, or ~ 30 lbs. overweight for 5’ 4” person) No Data <10% 10%–14% 15%–19% ≥20%
Obesity Trends* Among U.S. AdultsBRFSS, 1998 (*BMI ≥30, or ~ 30 lbs. overweight for 5’ 4” person) No Data <10% 10%–14% 15%–19% ≥20%
Obesity Trends* Among U.S. AdultsBRFSS, 1999 (*BMI ≥30, or ~ 30 lbs. overweight for 5’ 4” person) No Data <10% 10%–14% 15%–19% ≥20%
Obesity Trends* Among U.S. AdultsBRFSS, 2000 (*BMI ≥30, or ~ 30 lbs. overweight for 5’ 4” person) No Data <10% 10%–14% 15%–19% ≥20%
Obesity Trends* Among U.S. AdultsBRFSS, 2001 (*BMI ≥30, or ~ 30 lbs. overweight for 5’ 4” person) No Data <10% 10%–14% 15%–19% 20%–24% ≥25%
Obesity Trends* Among U.S. AdultsBRFSS, 2002 (*BMI ≥30, or ~ 30 lbs. overweight for 5’ 4” person) No Data <10% 10%–14% 15%–19% 20%–24% ≥25%
Obesity Trends* Among U.S. AdultsBRFSS, 2003 (*BMI ≥30, or ~ 30 lbs. overweight for 5’ 4” person) No Data <10% 10%–14% 15%–19% 20%–24% ≥25%
Obesity Trends* Among U.S. AdultsBRFSS, 2004 (*BMI ≥30, or ~ 30 lbs. overweight for 5’ 4” person) No Data <10% 10%–14% 15%–19% 20%–24% ≥25%
Obesity Trends* Among U.S. AdultsBRFSS, 2005 (*BMI ≥30, or ~ 30 lbs. overweight for 5’ 4” person) No Data <10% 10%–14% 15%–19% 20%–24% 25%–29% ≥30%
Obesity Trends* Among U.S. AdultsBRFSS, 2006 (*BMI ≥30, or ~ 30 lbs. overweight for 5’ 4” person) No Data <10% 10%–14% 15%–19% 20%–24% 25%–29% ≥30%
Obesity Trends* Among U.S. AdultsBRFSS, 2007 (*BMI ≥30, or ~ 30 lbs. overweight for 5’ 4” person) No Data <10% 10%–14% 15%–19% 20%–24% 25%–29% ≥30%
Obesity Trends* Among U.S. AdultsBRFSS,1990, 1998, 2007 (*BMI 30, or about 30 lbs. overweight for 5’4” person) 1998 1990 2007 No Data <10% 10%–14% 15%–19% 20%–24% 25%–29% ≥30%
Physical Education in School Percentage of Students Enrolled in Physical Education Class, by Grade LESS THAN 19% OF HIGH SCHOOL SENIORS PARTICIPATE IN DAILY P.E.
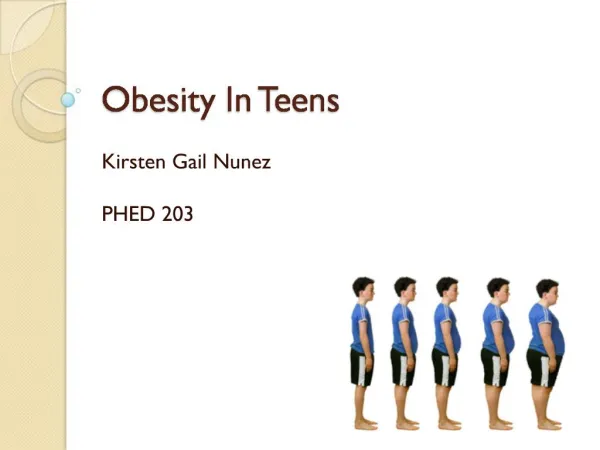
Obesity in US Children According to CDC estimates, some 6 million American children are seriously overweight. MORE THAN DOUBLED IN 30 YEARS
Physical Fitness & School "It's a real problem for kids. They're naturally active; then we put them in schools and teach them to be sedentary." - University of New Hampshire researcher Tammi Martin • Martin’s study found 88 percent of the state's schoolchildren can pass a four-part physical fitness test when they start kindergarten or first grade. • A year later, only 47 percent pass. • By the time they turn 10, when a fifth, aerobic measure is added to the test, only 18 percent meet the minimum physical fitness standards, researchers found.
Anatomy of Health WHAT HAS THE GREATEST INFLUENCE ON OUR WELLNESS? LIFESTYLE! 20% Environment 10% Medical Care 20% Genetics 50% Life Style Choices
Research Proves Physically Fit and Active Students: • Pay better attention in class • Are less disruptive in class • Retain information better • Are less likely to bully other students • Score higher on standardized tests • Have a higher self esteem
Academic Achievement and Physical Fitness • Study completed by the California Department of Education (released12/10/02) • Data included SAT 9 Mathematics and Reading plus Fitnessgram from 2001 • Test Results from 954,000 students in Grades 5, 7, 9
Why are Learning & Fitness Linked? Dr. Ratey says, "A 12-minute walk … causes the release of crucial neurotransmitters such as serotonin, dopamine, and norepinephrine.” “…positive effects result because exercise increases blood flow to the brain… causing the release of nerve-growth factors, or "Miracle-Gro for the brain." Dr. John Ratey – Harvard School of Medicine
Body Image Perception • Is your weight right for you? Do you know? • Some people think they need to gain or lose weight or change their appearance when they don’t - they worry so much about it they may: • Develop bulimia or anorexia (binging/purging or starving) • Take steroids &/or work out obsessively • Get surgical implants or plastic surgery • Explore these issues & the causes of body image perceptions on the Internet … & ask your school to serve healthy food & offer lots of fitness activities & courses!
Citations • BRFSS, Behavioral Risk Factor Surveillance System http: //www.cdc.gov/brfss/ • Mokdad AH, et al. The spread of the obesity epidemic in the United States, 1991—1998 JAMA 1999; 282:16:1519–1522. • Mokdad AH, et al. The continuing epidemics of obesity and diabetes in the United States. JAMA. 2001; 286:10:1519–22. • Mokdad AH, et al. Prevalence of obesity, diabetes, and obesity-related health risk factors, 2001. JAMA 2003: 289:1: 76–79 • CDC. State-Specific Prevalence of Obesity Among Adults — United States, 2005; MMWR 2006; 55(36);985–988
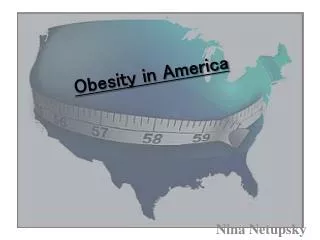
Obesity Trends Among U.S. Adults between 1985 and 2007 • Source of the data: • The data shown in these maps were collected through CDC’s Behavioral Risk Factor Surveillance System (BRFSS). Each year, state health departments use standard procedures to collect data through a series of monthly telephone interviews with U.S. adults. • Prevalence estimates generated for the maps may vary slightly from those generated for the states by BRFSS (http://aps.nccd.cdc.gov/brfss) as slightly different analytic methods are used.
In 1990, among states participating in the Behavioral Risk Factor Surveillance System, 10 states had a prevalence of obesity less than 10% and no states had prevalence equal to or greater than 15%. • By 1998, no state had prevalence less than 10%, seven states had a prevalence of obesity between 20-24%, and no state had prevalence equal to or greater than 25%. • In 2007, only one state (Colorado) had a prevalence of obesity less than 20%. Thirty states had a prevalence equal to or greater than 25%; three of these states (Alabama, Mississippi and Tennessee) had a prevalence of obesity equal to or greater than 30%.