Download
1 / 15
200 likes | 771 Views
THE CAPITAL ASSET PRICING MODEL (CAPM). The Capital Asset Pricing Model (CAPM) expresses the cost of equity capital as the sum of a required return on riskless assets, plus a premium for systematic (market) risk. Where :.

E N D
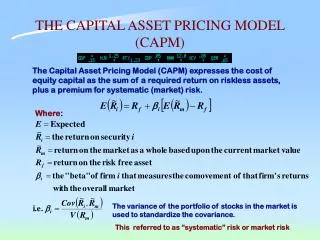
THE CAPITAL ASSET PRICING MODEL (CAPM) The Capital Asset Pricing Model (CAPM) expresses the cost of equity capital as the sum of a required return on riskless assets, plus a premium for systematic (market) risk. Where: The variance of the portfolio of stocks in the market is used to standardize the covariance. This referred to as “systematic” risk or market risk
THE MARKET MODEL Removing the E (the expected value), the formula for the realized return becomes: Where e is the unexpected or abnormal return. In other words, eirepresents the portion of a stock’s realized return that is different from the expected return given existing market conditions.
THE MARKET MODEL • Under modern portfolio theory (MPT) : • Risks are positively correlated with higher (expected) returns. The greater the risk the greater the possible return or conversely the greater the possible loss. This relationship holds only for the portion of risk associated with market risk (i. e. systematic risk). • Firms specific risk (i.e. unsystematic risk
WEIGHTED AVERAGE COST OF CAPITAL Where: Vd= the market value of debt Ve = the market value of equity rd= the cost of debt capital re = the cost of equity capital T = the tax rate reflecting the marginal tax benefit of interest
Estimating Cost of Debt • Should be based upon current market rates of interest • Public traded debt will have a market determined yield rate • Privately held debt does not have quoted rates but the stated rate • may be a good surrogate since rates may not have substantially • changed • Should calculated on an after tax basis by multiplying by (1-tax rate)
ESTIMATING THE COST OF CAPITAL One method is to use the Capital Asset Pricing Model (CAPM). This model expresses the cost of equity capital as the sum of a required return on riskless assets, plus a premium for systematic (market) risk. Where: The variance of the portfolio of stocks in the market is used to standardize the covariance. This referred to as “systematic” risk or market risk
EFFECTS OF FIRM SIZE • Empirical evidenced indicates the CAPM is incomplete. Long run average returns should be close to the cost of capital and should vary across stocks according to the systematic risk (I.e., ). This is not totally what is observed. • Other factors seem to play some role most notably “firm size.” Smaller firms (measured by market capitalization) tend have generate higher returns. It is not clear why this should be the case. It could be that they are more risky than indicated by CAPM, or that they are not followed as closely by market analysts and are under priced at the point their market capitalization is measured. Therefore another method is to combine CAPM and the firm size effect: Where: Rsizeis the difference between the average return on the Market Index (e.g. Standard and Poor’s 500) and the average return of firms of the size being evaluated.
Measuring Risk of Earnings Stream • Several factors contribute to the risk (variance) in the earning stream • Uncertainty of demand for output; i.e., Variance of Sales • Sales Variability Impacts Earnings and ROE as a function of the firms Operating and Financial Leverage • Uncertainty of Prices of Inputs and Outputs; i.e., Variance of Input and Output Prices
Measuring Risk of Earnings Stream • Analogous to the CAPM, variance in sales and earnings of the firm can consist of: • General Market Effect – Systematic Component • Firms Specific Effect – Unsystematic Component The Systematic components are referred to as Accounting Betas (BEarnings and BSales) in contrast to Market Betas These are the defined relationship of the firms operating results to general economic factors (average of all firms in the market)
Operating and Financial Risk • Operating Risk = f{OLE, Variance(Sales)} • Operating risk is also referred to as Business Risk • Financial Risk = FLE • Variance (Income) = Total Risk Total Risk = f{FLE, OLE, Variance (Sales)} % Change in Income = TLE = FLE x OLE x Change in Sales
Financial Leverage Degree of Financial Leverage = DFL: Percentage change in earnings per share relative to a percentage change in earnings before interest and taxes.
Operating Leverage Degree of Operating Leverage = DOL: Percentage change in earnings relative to a percentage change in the associated output
Relationship of OLE and FLE to Market Beta The systematic components of the firms earnings variability as measured by FLE and OLE are reflected in the firm’s market Beta