Download
1 / 80
940 likes | 1.28k Views
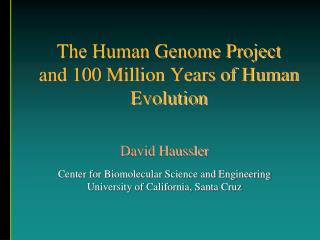
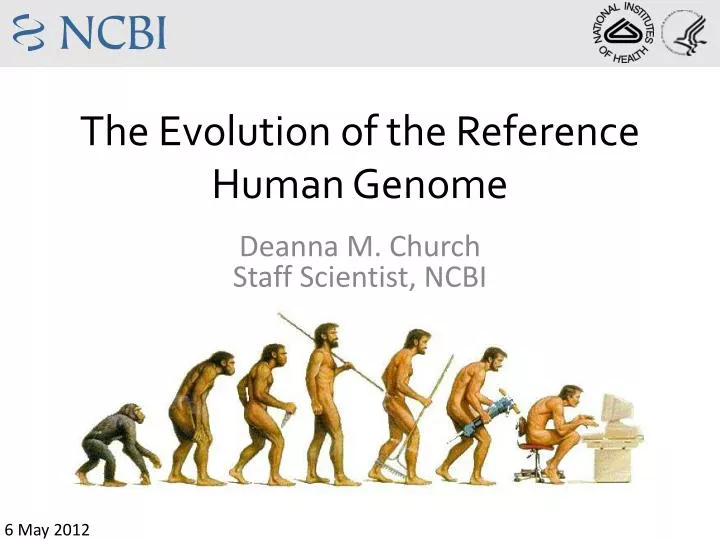
The Evolution of the Reference Human Genome. Deanna M. Church Staff Scientist, NCBI. 6 May 2012. February 2001. Throughput: 500 Mb/year Cost: < $0.25 per base Variation: 100,000 SNPs mapped. Collins FS et al, 1998. 1999. 2000. 2005. 2011. 2010. Steve Sherry, NCBI.

E N D
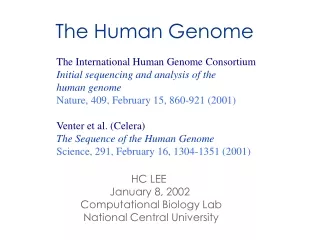
The Evolution of the Reference Human Genome Deanna M. Church Staff Scientist, NCBI 6 May 2012
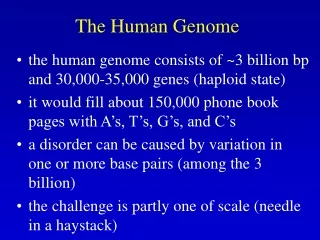
Throughput: 500 Mb/year Cost: < $0.25 per base Variation: 100,000 SNPs mapped Collins FS et al, 1998
1999 2000 2005 2011 2010 Steve Sherry, NCBI
Assumptions Variables: Reads are randomly distributed G= haploid genome length in bp L= sequence read length in bp N= number of reads sequenced T= amount of overlap needed for detection in bp C= Coverage Overlap between reads does not vary y= number of events in an interval l = mean number of events in an interval Poisson distribution P(Y=y)=(ly * e–l)/y! For sequence calculations, coverage can be viewed as l Using this equation, you can calculate the probability that a base hasbeen sequenced y number of times. By manipulating this formula, youcan estimate the numbers of gaps for any given level of coverage. How much sequence do you need? Lander and Waterman (1988) Genomics C=LN/G http://www.genetics.wustl.edu/bio5488/lecture_notes_2005/Lander.htm
2009 Sanger cost: shotgun sequence ~ $0.01/base finished sequence ~ $0.03/base This clone: Shotgun=$1500 Finish=$3000
Captured gap= no sequence, but a clone spans the gap Uncaptured gap= no sequence, no clone spanning gap Bob Blakesly, NISC
Phred quality scores: Measures the probability that a base is incorrect. If a base has a 1/1000 probability of being incorrect, it has a Phred score of 30. 20 Quality scores Base Not all bases are created equal Sanger Sequencing
Shotgun sequence deeper sequence coverage rarely resolves all gaps Fold sequence Assemble Gaps GAPS “finishers” go in to manually fill the gaps, often by PCR BAC insert BAC vector Clone based assemblies
Restrict and make libraries 2, 4, 8, 10, 40, 150 kb Find sequence overlaps tails WGS contig End-sequence all clones and retain pairing information “mate-pairs” Each end sequence is referred to as a read Scaffold WGS: Sanger Reads
De Bruijn graph representations Error free, no repeat, no polymorphism Sequencing error (short reads) Repeat > kmer length SNP, variant, long read error Structural variant, inversion Structural variant, deletion… … Ewan Birney, EBI
De Bruijn graph representations Ewan Birney, EBI
fragment meiosis- genetic radiation- RH enzyme- clone based genome • each line represents an individual cell line/animal that carries a particularbreak • - STSs can be amplified from DNA in these cell lines/animals- based on cell line/animal marker content, the breaks can be determined andthe markers ordered.
Electronic PCR (e-PCR) STS marker D6S1606 microsatellite repeat forward primer GAGTTTGCACCATTGCACTCCAGCCTGGGCAACAAGAGTGAAACTCTGTCACAGA (CA)n AACGTGGCATGTGCCTGTACTCTC CTCAAACGTGGTAACGTGAGGTCGGACCCGTTGTTCTCACTTTGAGACAGTGTCT (GT)n TTGCACCGTACACGGACATGAGAG reverse primer PCR product size: 92 - 100 bases E-PCR software searches DNA sequences for exact matches to both primers in correct order, orientation, and spacing to be consistent with known PCR product size. Schuler (1997), Genome Research 7, 541-550
Electronic PCR (e-PCR) http://www.ncbi.nlm.nih.gov/sutils/e-pcr/
A B C F F D G G E H H F K K G L L H A A I B B J C C K D D L M N O O O N (flip) N Putting genomes together Ideally… Non-sequence based Map
A A A A B B B B C C C D D Y Z E Y F X ? G W H H H H I I I J J J J V K L L L M M M M N N N N O O O O Putting genomes together More like…
WI Genetic WI/MRC RH Sequence vs. Non-sequence based maps Mmu7
5 60 4 40 3 2 20 1 0 0 -1 20 -2 -3 40 -4 Select regulatory molecule Other transcription factor Nucleic acid binding G-protein modulator Extracellular matrix -5 60 Ribosomal protein Protein kinase Unclassified Hydrolase Chemokine Oxygenase Kinase Apolipoprotein Oxidoreductase Structural protein Cytokine receptor Cysteine protease Transcription factor Signaling molecule Intermediate filament Miscellaneous function Cell adhesion molecule Other cytokine receptor Defense/immunity protein Cysteine protease inhibitor Other cell adhesion molecule Zinc finger transcription factor KRAB box transcription factor Tumor necrosis factor receptor CAM family adhesion molecule Immunoglobulin receptor family member Major histocompatibility complex antigen Enrichment Observed Expected Human- panther classifications (biological process) Evan Eichler, University of Washington
Church et al., 2009 Leo Goodstadt
Inter-chromosomal Intra-chromosomal Both Mouse Human Mouse has an increased amount of intra-chromosomal duplication when compared to human
Martin Shumway 5.E+13
YH1 (BGI) KB1 (BGI) Craig, part1 Craig, Part 2 Broad NA12878
Gaps Closed Issues 5 July 2011 Open Issues
Large-Scale Variation Complicates Genome Assembly Sequences from haplotype 1 Sequences from haplotype 2 Old Assembly model: compress into a consensus New Assembly model: represent both haplotypes
MAPT UGT2B17 MHC 7 alternate haplotypesat the MHC Alternate loci released as: FASTA AGP Alignment to chromosome http://genomereference.org GRCh37 (hg19)
ALT 1 Non-nuclear assembly unit (e.g. MT) Assembly (e.g. GRCh37) ALT 2 PAR Primary Assembly ALT 6 ALT 3 Genomic Region (UGT2B17) Genomic Region (MHC) Genomic Region (MAPT) ALT 7 ALT 4 ALT 8 ALT 5 ALT 9
NCBI36NC_000004.10 (chr4) Tiling Path TMPRSS11E TMPRSS11E2 TMPRSS11E TMPRSS11E GRCh37NC_000004.11 (chr4) Tiling Path AC147055.2 AC079749.5 AC021146.7 AC134921.1 AC074378.4 AC093720.2 AC079749.5 AC147055.2 AC019173.4 AC021146.7 AC134921.2 AC140484.1 AC093720.2 AC074378.4 GRCh37: NT_167250.1 (UGT2B17 alternate locus) AC021146.7 AC019173.4 AC074378.4 AC226496.2 AC140484.1 Xue Y et al, 2008
H1 H2 17q deletion Zody et al, 2008