Download
1 / 15
150 likes | 237 Views
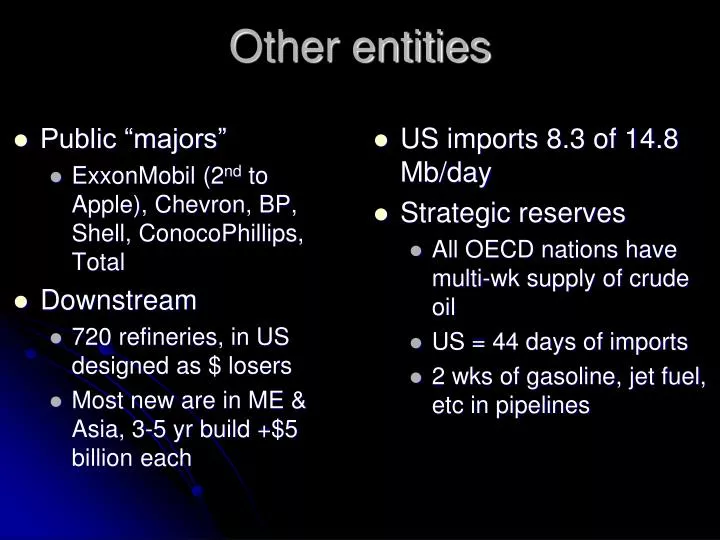
Other entities. Public “majors” ExxonMobil (2 nd to Apple), Chevron, BP, Shell, ConocoPhillips, Total Downstream 720 refineries, in US designed as $ losers Most new are in ME & Asia, 3-5 yr build +$5 billion each. US imports 8.3 of 14.8 Mb/day Strategic reserves

E N D
Other entities • Public “majors” • ExxonMobil (2nd to Apple), Chevron, BP, Shell, ConocoPhillips, Total • Downstream • 720 refineries, in US designed as $ losers • Most new are in ME & Asia, 3-5 yr build +$5 billion each • US imports 8.3 of 14.8 Mb/day • Strategic reserves • All OECD nations have multi-wk supply of crude oil • US = 44 days of imports • 2 wks of gasoline, jet fuel, etc in pipelines
Who has oil? Oil flow = # of supertankers Who uses it? What limits the flow? According to MBAs …
… Above ground factors • Investment bubblers & Cartels • Extreme weather damage • No new US refineries (NIMBY) • Inefficient use
US oil production Horiz. drilling
Oil reservoir factors • Discovery (seismic, 2D 3D/4D Off-shore drill rigs, complex & one-shot, so very expensive & limited
Declining N. Sea oil extraction State of art reservoir management to maximize total oil production
EXPORT LAND MODEL • NOCs limit exports to maintain domestic supply & extend duration of “petrowealth” • Financial constraints on new reservoir development • Water & electricity availability Projection based on past experience 1990 2003
… According to “Peak Oilers” Global per capita power declining (flat energy supply consumed by growing # of users) ERoEI declining because we drain large concentrated reservoirs, but new finds are mostly smaller/deeper • Larger effort/energy use for new reservoirs • More waste pollution refining lower-grade fuels • Rusting infrastructure & aging workforce, petroleum no longer seen as “sexy” • Innovations are now complex “one-off”, not breakthroughs w/ wide application
So many constraints! Can we estimate when world flow will decline?Mistaken calls have been made before Is there any science to Peak Oil?
1970 Shows that Texas has extracted 90% of all its recoverable oil Hubbert’s “curve fitting” Plot (annual extraction) / (total extracted to date) vs. total extracted to date. Plot starts at (1st year,1st year), over time drops to (ultimate recoverable, 0) After “noisy” start, curve settles to straight line, so perhaps can extrapolate to predict ultimate (total) recoverable resource (URR) in future Stepping back halfway approximates year extraction starts to decline (= peak)
Peak oil “rolloff timing Tar sands • FACT: Too few large-volume projects underway to overcome post-2013 depletion • FACT: New projects tap non-conventional oils, costly & difficult, deliver smaller flowsafter delays
FACT: crude oil production has not increased for 5.5 yrs despite high prices until 2 yrs ago Simplest explanation: Oil flow will no longer grow Will “tar sands” help?
BUTHubbert “analysis” is only curve fitting, no predictive power, only appeal to precedent. Not science! Is there a physical model of oil depletion?Yes! First simplification: separate discovery from extraction