Download
1 / 35
350 likes | 594 Views
Regional coupled ocean modelling Karen Assmann Bjerknes Centre for Climate Research, Bergen, Norway. Atmospheric forcing & Surface fresh water fluxes. Sea ice drift in the Amundsen Sea. Assmann et al., JGR, 2005. NCEP Forcing in the Amundsen Sea.

E N D
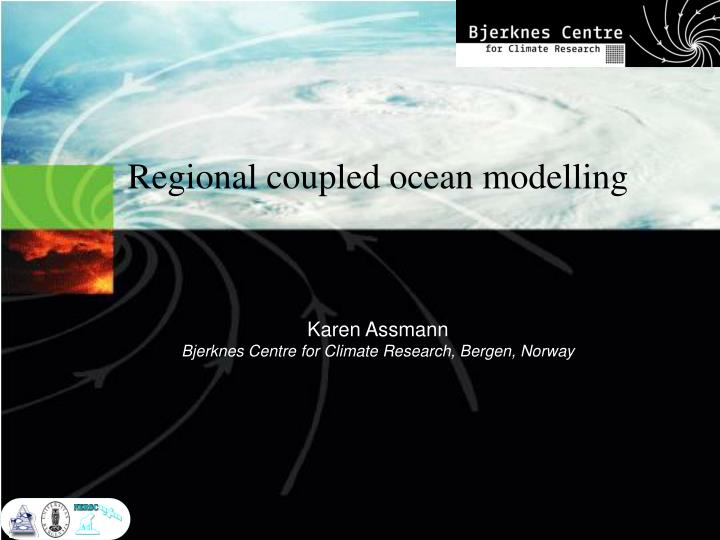
Regional coupled ocean modelling Karen Assmann Bjerknes Centre for Climate Research, Bergen, Norway
Sea ice drift in the Amundsen Sea Assmann et al., JGR, 2005
NCEP Forcing in the Amundsen Sea NCEP 2m Air Temperatures vs Air Temperatures from a sea ice buoy in the Amundsen sea (March 2000 – Oct 2001) NCEP 10m winds vs NB Palmer Shipboard data (Amundsen Sea, February/March 2000) Assmann et al., JGR, 2005
Previous evaluations of Reanalysis data Wind speed bias (NCEP-WOCE ship) Smith et al., J.Clim, 2001
Previous evaluations of Reanalysis data Correlation of Reanalyses 2m air temperatures with observations at Antarctic stations Bromwich & Fogt, J.Clim, 2004
Limitations of ice-ocean models forced by Reanalyses – The Weddell Polynya Sea ice thickness anomaly in BRIOS2.2 August 1975 R. Timmermann, pers.comm.
Limitations of ice-ocean models forced by Reanalyses – The Weddell Polynya NCEP 2-m Temperature for August 1975 Sea ice thickness anomaly in BRIOS2.2 August 1975 R. Timmermann, pers.comm.
Limitations of ice-ocean models forced by Reanalyses – The Weddell Polynya NCEP 2-m Temperature for August 1975 Sea ice thickness anomaly in BRIOS2.2 August 1975 Simulated MLD September 1975 R. Timmermann, pers.comm.
Sensitivity of ice extent and thickness to air temperature Sea ice thickness Amundsen Sea Mean annual cycle of sea ice extent Amundsen Sea (100 – 150 W) BRIOS2.2 vs SSM/I Assmann et al., JGR, 2005
Precipitation & its influence on sea ice e.g. Amundsen Sea: Ice Shelves: Model: 3 mSv Estimate from Observations: 4.9 mSv (Jacobs et al., 1996) P-E (NCEP mean 1978-2001): 13.4 mSv Snow ice: Model: 25 % of ice volume Obs: 14-60 % (Jeffries et. al, 1997&1998) Assmann et al., JGR, 2005
P-E & Sea Ice ECMWF CSIRO9 GASP Mean September sea ice concentration Marsland & Wolff, JGR, 2001
Surface fresh water fluxes & sea ice Mean September sea ice concentration CSIRO9 GASP ECMWF P-E + 10 cm/a Glacial FW flux (68 mSv S of 60 S) Marsland & Wolff, JGR, 2001
Ice shelf fresh water flux, sea ice thickness & water mass characteristics Difference in TS-Characteristics Without cavities - with Weddell SeaRoss Sea Sea Ice thickness Without ice shelf cavities – with cavities Hellmer, GRL, 2004
Cross-shelf exchange in the Ross Sea Resolution: 5 km Run for 1 year, start mid-September Open boundaries, WOA S&T, OCCAM velocities Total cross-shelf transport over 1 year Red on-shelf, Blue off-shelf T at 300m at model day 350 (early September) Dinniman et. Al, DSRII, 2003
Regional modelling of circulation and water masses in ice shelf cavities e.g. FRIS Jenkins et al., JGR, 2004
Regional coupled biological-physical modelling Ross Sea Simulated surface Cl a concentration ACC Simulated summer surface concentrations Phytoplankton (g Cl a/l) Zooplankton (C/l) Dissolved iron (nmol/l) Silicate (mol/l) Hense et al., JMS, 2003 Arrigo et al., JGR, 2003
Regional Models • Mostly focussed on continental shelf • Coupled to => Biology => Ice shelf cavities • Effect of boundaries => strong control on model circulation • Useful to directly supplement observations & identify processes affecting observations • Separate from larger models - link through nesting?
Parametrization of vertical mixing in the Weddell Sea Observed Temperature section HASO SSM/I sea ice concentration Winter 1993 Model Sensitivity studies using BRIOS Timmermann & Beckmann, OM, 2004
Dense shelf water variability in the Ross Sea Simulated HSSW salinity and temperature in the SW Ross Sea Correlation of HSSW signal with 150m S and 400m T No lag 5-year lag Assmann & Timmermann, OD, 2005
Transport & origin of dense water masses crossing the South Scotia Ridge Integrated transports Philip Passage Model grid in the Weddell Sea Orkney Passage Bransfield Strait Schodlok et al., DSR, 2002
FESOM - applications I. Circumpolar Southern Ocean configuration seasonal cycle of ice thickness • follows „BRIOS“ concept • 1.5° x 1.5°cos horizontal resolution; additional nodes at coast • open boundary with sponge zone at 48°S • 9000 surface nodes, 26 layers • has been run for many 100yrs by now R. Timmermann, pers. comm. 0 1.5 3.0 m
Circumpolar Models • Control on inflow water masses to SO (& ACC transport) • No boundaries for sea ice & marginal seas • Allow investigation of interaction between shelf & deep basin
Regionally focussed global modelsHOPE & the Mertz Polynya Simulated sea ice concentration & drift Grid resolution [km] Simulated salinity at 400 m Marsland et al., JGR, 2004
Antarctic sea ice in a global model Model (ORCALIM) Satellite data (SSM/I) Timmermann et al., Ocean Modelling, 2005
Validation of sea ice thickness- The ASPeCt data set - Mean sea ice thickness from ASPeCt data set (Gridded onto ORCALIM2 grid) Number of observations in each grid cell Timmermann et al., JGR, 2004
Model vs Observations Difference from ASPeCt data Real-time sampled model sea ice thickness Timmermann et al., JGR, 2004
Observations & Model ASPECT data set corrected by the bias between RTS and long-term mean model results Timmermann et al., JGR, 2004
Evaluating global ocean carbon modelsThe importance of realistic physics Doney et al., GBC, 2004
Ocean acidification in the SO Aragonite Saturation State in the Year 2100 (Model Composite) Atlantic Pacific Orr et al., Nature, 2005
Global Models • No need for boundary conditions • Not necessarily SO focussed, but widely available • Resolution generally sufficient to investigate both basin-scale processes in SO as well as SO role in global ocean • Larger community - good basis for comparison • OCMIP - strong interest of carbon community for SO