Download
1 / 1
10 likes | 130 Views
IRT Modeling of Tutor Performance to Predict End-of-Year Exam Scores Elizabeth Ayers Supported in part by IES Training Grant (# R305B040063). Stage 1: The IRT Models. Example of the Assistment System. Stage 3: Predicting MCAS Exam Scores.

E N D
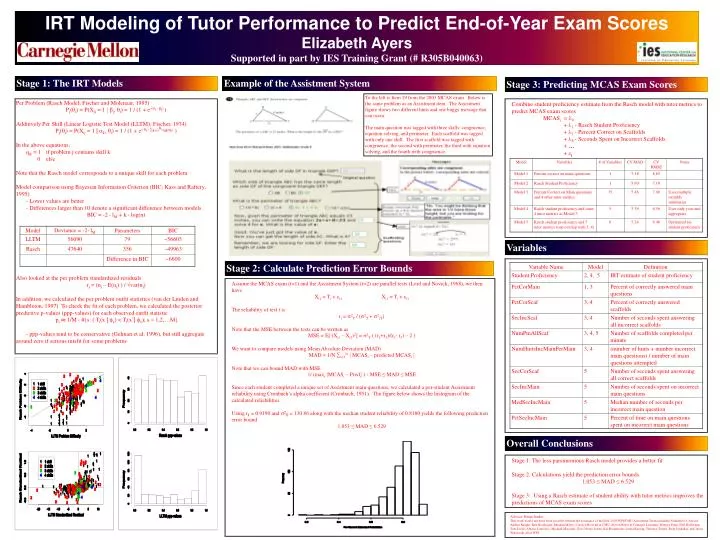
IRT Modeling of Tutor Performance to Predict End-of-Year Exam Scores Elizabeth Ayers Supported in part by IES Training Grant (# R305B040063) Stage 1: The IRT Models Example of the Assistment System Stage 3: Predicting MCAS Exam Scores To the left is Item 19 from the 2003 MCAS exam. Below is the same problem as an Assistment item. The Assistment figure shows two different hints and one buggy message that can occur. The main question was tagged with three skills: congruence, equation solving, and perimeter. Each scaffold was tagged with only one skill. The first scaffold was tagged with congruence, the second with perimeter, the third with equation solving, and the fourth with congruence. Per Problem (Rasch Model; Fischer and Molenaar, 1995) Pj(i) = P(Xij = 1 jj, i) = 1 / (1 + e-(i - j) ) Additively Per Skill (Linear Logistic Test Model (LLTM); Fischer, 1974) Pj(i) = P(Xij = 1 jk, i) = 1 / (1 + e-(i - k=1K qjkk) ) In the above equations, qjk = 1 if problem j contains skill k 0 else Note that the Rasch model corresponds to a unique skill for each problem Model comparison using Bayesian Information Criterion (BIC; Kass and Raftery, 1995) - Lower values are better - Differences larger than 10 denote a significant difference between models BIC = -2 ¢ lM + k ¢ log(n) Also looked at the per problem standardized residuals rj = (nj – E(nj) ) / √var(nj) In addition, we calculated the per problem outfit statistics (van der Linden and Hambleton, 1997) To check the fit of each problem, we calculated the posterior predictive p-values (ppp-values) for each observed outfit statistic pi¼ 1/M ¢ #{s: ( Ti(x jx) < Ti(x*jx); s = 1,2,…M} - ppp-values tend to be conservative (Gelman et al, 1996), but still aggregate around zero if serious misfit for some problems • Combine student proficiency estimate from the Rasch model with tutor metrics to predict MCAS exam scores • MCASi = 0 • + 1¢ Rasch Student Proficiency • + 2¢ Percent Correct on Scaffolds • + 3¢ Seconds Spent on Incorrect Scaffolds • + … • + i Variables Stage 2: Calculate Prediction Error Bounds • Assume the MCAS exam (t=1) and the Assistment System (t=2) are parallel tests (Lord and Novick, 1968), we then have • Xi1 = Ti + i1 Xi1 = Ti + i1 • The reliability of test t is • rt = 2T / (2T + 2T) Note that the MSE between the tests can be written as MSE = E[ (Xi1 – Xi2)2] = 2T ( (r1+r2)/(r1¢ r2) – 2 ) We want to compare models using Mean Absolute Deviation (MAD) MAD = 1/N i=1Nj MCASi – predicted MCASij Note that we can bound MAD with MSE 1/ (maxijMCASi – Predij ) ¢ MSE ≤ MAD ≤ MSE Since each student completed a unique set of Assistment main questions, we calculated a per-student Assistment reliability using Cronbach’s alpha coefficient (Cronbach, 1951). The figure below shows the histogram of the calculated reliabilities. Using r1 = 0.9190 and 2T = 130.86 along with the median student reliability of 0.8180 yields the following prediction error bound 1.053 ≤ MAD ≤6.529 Overall Conclusions Stage 1: The less parsimonious Rasch model provides a better fit Stage 2: Calculations yield the prediction error bounds 1.053 ≤ MAD ≤6.529 Stage 3: Using a Rasch estimate of student ability with tutor metrics improves the predictions of MCAS exam scores Advisor: Brian Junker This work would not have been possible without the assistance of the2004-2005 WPI/CMU Assistment Team including Nathaniel O. Anozie, Andrea Knight, Ken Koedinger, Meghan Myers, Carolyn Rose all at CMU, Steven Ritter at Carnegie Learning, Mingyu Feng, Neil Heffernan, Tom Livak, Abraao Lourenco, Michael Macasek, Goss Nuzzo-Jones, Kai Rasmussen, Leena Razzaq, Terrence Turner, Ruta Upalekar, and Jason Walonoski all at WPI.