Download
1 / 16
160 likes | 251 Views
Impacts of air pollution on ecosystems, human health and materials under different Gothenburg Protocol scenarios. a LRTAP dataflow.

E N D
Impacts of air pollution on ecosystems, human health and materials under different Gothenburg Protocol scenarios a LRTAP dataflow A.C. Le Gall, S. Doytchinov, R. Fischer, M. Forsius, H. Harmens, J.-P. Hettelingh, A. Jenkins, M. Krzyzanowski, B. Kvæven, M. Lorenz, L. Lundin, G.E. Mills, F. Moldan, M. Posch, B.L. Skjelkvåle, J. Tidblad, R. F. Wright All WGE’s ICPs and TF and EMEP
WGE indicators analysis: Data needs ICP modelling and mapping Eutrophication N, S Deposition ICP forests Acidification ICP waters Ozone concentration ICP integrated monitoring Ozone ICP vegetation Meteorological data ICP materials Multi-pollutant TF health JEG dyn mod
Projections/scenarios available • NAT 2000: Historic data (partly Eurostat) • NAT 2020: Assumed national emissions (reported from the countries) • PRI 2020 and 2030: Projections (mainly) by PRIMES – an emissions energy consumption model • MFR 2020 – Maximum feasible reduction plan – how much is possible to reduce with present day technology • Data as available in October 2010 Data provided by TF IAM / CIAM and MSCW
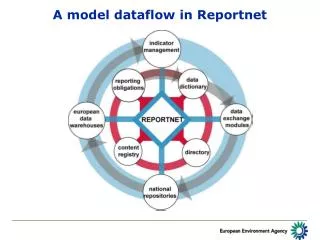
EMEP-WGE-WGSR data flow TF measurement & modelling (MSCW, MSCE) ICP modelling and mapping ICP forests ICP waters ICP integrated monitoring TF IAM ICP vegetation ICP materials TF health JEG dyn mod WGE EMEP Colour code WGSR
Eutrophication ICP IM: Decrease of impacts is expected at various sites • The number of sites impacted decreases by about 20% in 2020 compared with baseline (70% with MFR) • The magnitude of the impact is reduced by about 40% with baseline in 2020 (80% with MFR) Number of sites protected /not protected with respect to critical loads for eutrophication for terrestrial ecosystems Average exceedance of the critical loads for eutrophication for terrestrial ecosystems
Eutrophication ICP M&M: modelling at european scale confirms sites previsions CCE Status report • % areas at risk of eutrophication Accumulated Average Exceedance of critical loads for eutrophication
ICP Waters: dynamic modelling shows recovery… and its limits Good match of modelled and monitoring data Conclusion (with NAT2020): ANC goes over ANC limit and levels off Bad years, acidification may occur NAT, PRI are equivalent as far as water acidification is concerned Acidification Highly sensitive sites will not recover even under MFR. See presentation by Brit Lisa Skjelkvåle for further details
Ozone ICP Vegetation:Ozone is of concern for food security POD6 (mmol.m-²) = phytotoxic ozone dose NAT2000 NAT2020 The magnitude of the impact will be reduced The areas (intensely) impacted are reduced But the impact will still occur in a large part of Europe Ozone impact on wheat production See presentation by Gina Mills for further details
Multi-pollutant ICP Materials: Effects on materials will decrease but will not disappear by 2020 NAT2000 NAT2020 MFR2020 More intense effects are expected in urban areas than shown on maps.
EMEP-WGE-WGSR data flow TF measurement & modelling (MSCW, MSCE) ICP modelling and mapping ICP forests ICP waters TF IAM ICP integrated monitoring ICP vegetation ICP materials TF health JEG dyn mod WGSR WGE EMEP Colour code WGSR
Overall conclusions • Similar observations from all groups and for all effects: • Area impacted decreases • Magnitude of impact decreases Acidification Eutrophication Ozone Multi-pollutant underestimated
Conclusions to WGSR Eutrophication • Monitored and modelled indicators indicate only limited improvements in eutrophication status. Reduction in N emissions remain insufficient to decrease areas of risk for eutrophication. • Ozone impacts on ecosystems, food security and human health will remain very important. • Effects of air pollution on materials and health probably underestimated in urban areas with present models. • Decrease in emissions of S and N, and thereby decrease in deposition, have led to reduced surface waters acidification and a start of biological recovery in many acid sensitive sites. Improvement will continue. Ozone Multi-pollutant Acidification
EMEP-WGE-WGSR data flow TF hemispheric transports TF measurement & modelling (MSCW, MSCE) ICP modelling and mapping TF inventories ICP forests ICP waters TF IAM ICP integrated monitoring EGTEI ICP vegetation ICP materials NEBEI TF health TF HM JEG dyn mod WGSR TF POP WGE EMEP Colour code TF RN WGSR
EMEP-WGE-WGSR data flow TF hemispheric transports TF measurement & modelling (MSCW, MSCE) ICP modelling and mapping TF inventories ICP forests ICP waters TF IAM ICP integrated monitoring EGTEI ICP vegetation ICP materials NEBEI TF health TF HM JEG dyn mod WGSR TF POP WGE EMEP Colour code TF RN WGSR
THANK YOU FOR YOUR ATTENTION On behalf all my colleagues within the Working Group on Effects that have contributed to this analysis and to the results in this presentation