Download
1 / 1
10 likes | 115 Views
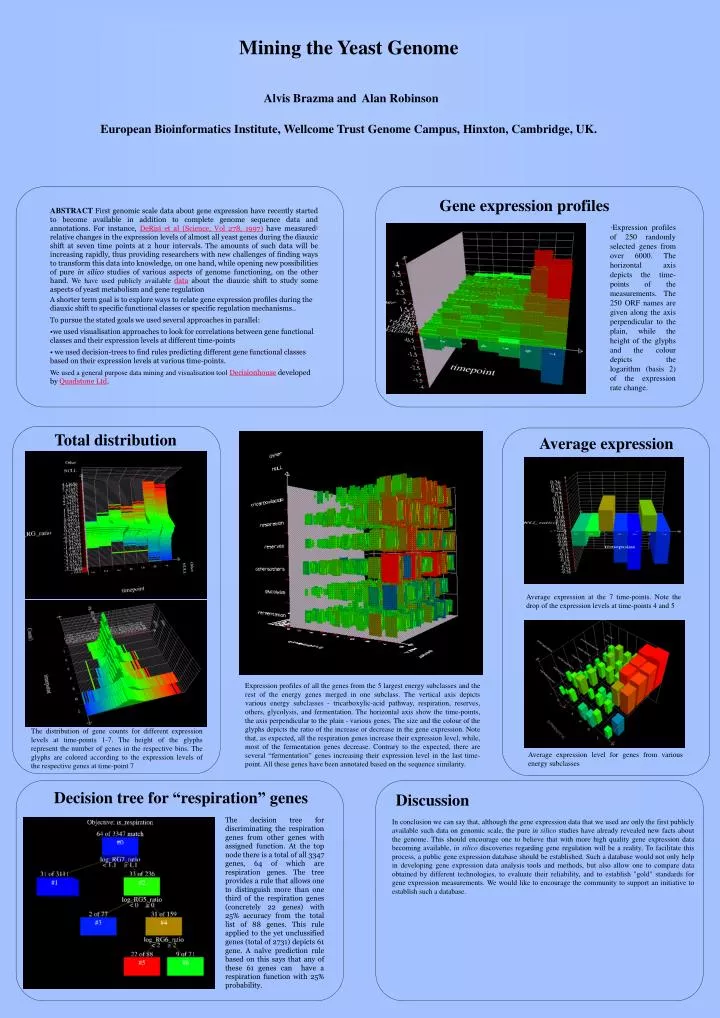
Mining the Yeast Genome Alvis Brazma and Alan Robinson European Bioinformatics Institute, Wellcome Trust Genome Campus, Hinxton, Cambridge, UK. Gene expression profiles.

E N D
Mining the Yeast Genome Alvis Brazma andAlan RobinsonEuropean Bioinformatics Institute, Wellcome Trust Genome Campus, Hinxton, Cambridge, UK. Gene expression profiles • ABSTRACT First genomic scale data about gene expression have recently started to become available in addition to complete genome sequence data and annotations. For instance, DeRisi et al (Science, Vol 278, 1997) have measured1 relative changes in the expression levels of almost all yeast genes during the diauxic shift at seven time points at 2 hour intervals. The amounts of such data will be increasing rapidly, thus providing researchers with new challenges of finding ways to transform this data into knowledge, on one hand, while opening new possibilities of pure in silico studies of various aspects of genome functioning, on the other hand. We have used publicly available data about the diauxic shift to study some aspects of yeast metabolism and gene regulation • A shorter term goal is to explore ways to relate gene expression profiles during the diauxic shift to specific functional classes or specific regulation mechanisms.. • To pursue the stated goals we used several approaches in parallel: • we used visualisation approaches to look for correlations between gene functional classes and their expression levels at different time-points • we used decision-trees to find rules predicting different gene functional classes based on their expression levels at various time-points. • We used a general purpose data mining and visualisation tool Decisionhouse developed by Quadstone Ltd. • Expression profiles of 250 randomly selected genes from over 6000. The horizontal axis depicts the time-points of the measurements. The 250 ORF names are given along the axis perpendicular to the plain, while the height of the glyphs and the colour depicts the logarithm (basis 2) of the expression rate change. Total distribution Average expression Average expression at the 7 time-points. Note the drop of the expression levels at time-points 4 and 5 Expression profiles of all the genes from the 5 largest energy subclasses and the rest of the energy genes merged in one subclass. The vertical axis depicts various energy subclasses - tricarboxylic-acid pathway, respiration, reserves, others, glycolysis, and fermentation. The horizontal axis show the time-points, the axis perpendicular to the plain - various genes. The size and the colour of the glyphs depicts the ratio of the increase or decrease in the gene expression. Note that, as expected, all the respiration genes increase their expression level, while, most of the fermentation genes decrease. Contrary to the expected, there are several “fermentation” genes increasing their expression level in the last time-point. All these genes have been annotated based on the sequence similarity. The distribution of gene counts for different expression levels at time-points 1-7. The height of the glyphs represent the number of genes in the respective bins. The glyphs are colored according to the expression levels of the respective genes at time-point 7 Average expression level for genes from various energy subclasses Decision tree for “respiration” genes Discussion • The decision tree for discriminating the respiration genes from other genes with assigned function. At the top node there is a total of all 3347 genes, 64 of which are respiration genes. The tree provides a rule that allows one to distinguish more than one third of the respiration genes (concretely 22 genes) with 25% accuracy from the total list of 88 genes. This rule applied to the yet unclussified genes (total of 2731) depicts 61 gene. A naïve prediction rule based on this says that any of these 61 genes can have a respiration function with 25% probability. In conclusion we can say that, although the gene expression data that we used are only the first publicly available such data on genomic scale, the pure in silico studies have already revealed new facts about the genome. This should encourage one to believe that with more high quality gene expression data becoming available, in silico discoveries regarding gene regulation will be a reality. To facilitate this process, a public gene expression database should be established. Such a database would not only help in developing gene expression data analysis tools and methods, but also allow one to compare data obtained by different technologies, to evaluate their reliability, and to establish "gold" standards for gene expression measurements. We would like to encourage the community to support an initiative to establish such a database.