Download
1 / 19
190 likes | 327 Views
Classifying Gene Expression Profiles from Pairwise mRNA Comparisons. Yan Qi Biomedical Engineering Department 10/3/2006. Outline. The problem of Molecular classification The TSP classifier

E N D
Classifying Gene Expression Profiles from Pairwise mRNA Comparisons Yan Qi Biomedical Engineering Department 10/3/2006
Outline • The problem of Molecular classification • The TSP classifier • Results on three Cancer datasets • Extensions of the TSP classifier
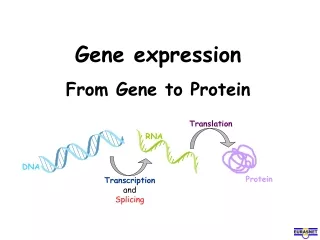
Molecular Classification • Objective: predict class labels, e.g. cancer subtypes, disease states using gene expression profiles • Data: G x n matrix, G is number of genes, n is number of samples, each column is a gene expression profile
Mathematical formulation • Gene expression profile: X = ( X1, X2, …, XG) • Binary Class label: Y = 1 or Y = 2 • Classifier: A mapping f from X toY • Training dataset: • A = G x n matrix, n = n1+n2 • Y: G x 1 vector where n1 entries are 1, n2 entries are 2 • Learning: find a mapping from A to f that minimizes generalization error
Challenges to standard learning methods • Statistical dilemma: n << G • Examples • Consequence: Over-fitting hence poor generalizability • Practical issue: complex f and DB • Example:ANN, SVM, random forests • Consequence: results are hard to interpret biologically, inefficient in diagnostic settings
The TSP classifier:Motivation and strategy • Rank-based scoring exploits the expression levels of genes relative to each other and obtains invariance to normalization. • Reduce model complexity by making the classifier parameter free • Select informative gene pairs by proper LOOCV and construct intuitive and biologically interpretable classification rule by voting.
TSP classifier:rank-based score • Idea: replace expression value by genes’ ranks within profiles. • Feature: • Score: where
Gene pair selection • TSP: • The number of TSP and sample size • A few when sample size is not too small ( >102). • Many when sample size is small ( < 102 ). • Example: myocardial tissue gene expression profiles • G = 22283; n1=12, n2=10; • 2460 statistically significant TSPs
Classification with one gene pair • Let be a unique TSP • Suppose • TSP classifier: • Error on training set:
Classification with multiple gene pairs – majority vote • Seek a mapping from outputs of multiple single TSP classifiers to a final prediction. • Let Output from represent a vote from TSP i. Final prediction = class that receives the majority vote from • Assume the features are conditionally independent given the class and equal, a Naïve Bayes classifier is equivalent to using majority vote
Classification with multiple TSPs:majority vote & Naïve Bayes classifier • Assume Where Let Naïve Bayes Classifier: • Each TSP contribute equally if
Loop of cross-validation • Leave-one-out CV • Estimated accuracy: 1 - e/n where e is total number of errors in cross-validation • Only the TSPs are determined by CV, unbiased error estimate. • More complicated models, e.g. ANN and Decision tree need to include both model topology and parameters in CV loop, more likely to be biased.
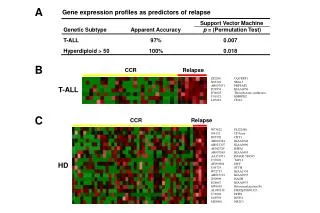
Three bench-mark cancer datasets • Determine lymphnode status in breast tumor samples ( West et al. 2001, G=7129, n = 49 ) • Classify leukemia subtypes ( Golub et al 1999, G= 7129, n=72) • Distinguish prostate tumors from normal samples ( Singh et al. 2002, G = 12600, n=102)
Statistical significance of the score is evaluated by permutation test • Repeat e.g. 1000 times • Keep feature matrix A • Randomize class labels by keeping • n1 and n2 unchanged • Get top score Zmax • Get histogram of Zmax
What does TSP represent? • Change weak predictors into strong predictors? • Change reference e.g. gene 3 as reference for gene 1 and gene 2 • Combine two markers e.g. x4 and X5 might be individual markers, one for each class, x4|-|X5 ?
Performance of TSP classifier compared with previous studies • Breast cancer: k-nearest neighbors (8-26); DLDA (8-19); DQDA (11-26) • logitboost (9-21); random forests (6-20); SVM (7-29) • Leukemia: correlation analysis + weighted vote (85% on test set and 95% • on CV set. • Prostate cancer: k-nearest neighbour to genes chosen by t-statistic
Discussion and extensions • Multiple class classification • Unique TSP: when there are >>1 TSPs, which is the most informative? • kTSP: there might be many pairs of genes with informative ordering, combine this information for more accurate classification? • Normalization invariance:a suitable method to integrate heterogeneous microarray datasets where experimental conditions and normalization schemes differ.