Download
1 / 1
10 likes | 132 Views
Soil CO 2 Efflux from a Subalpine Catchment Diego A. Riveros-Iregui 1 , Brian L. McGlynn 1 , Vincent J. Pacific 1 , Howard E. Epstein 2 , Daniel L. Welsch, Kelsey Jencso 1

E N D
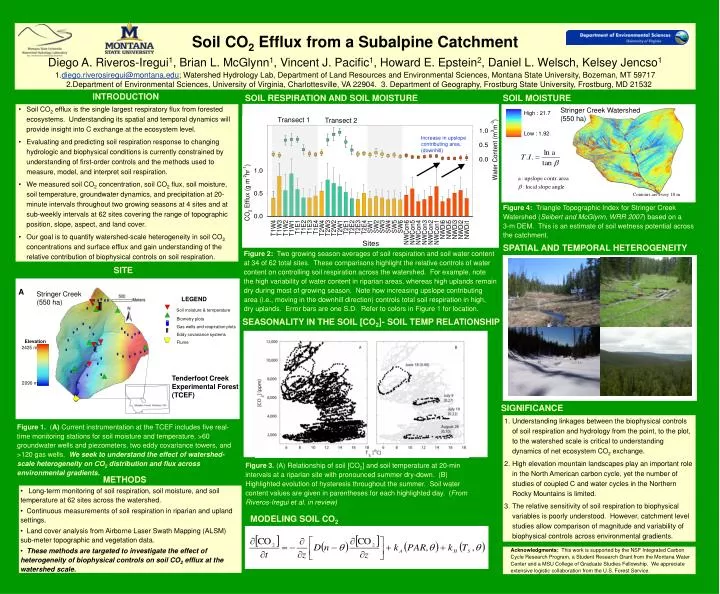
Soil CO2 Efflux from a Subalpine Catchment Diego A. Riveros-Iregui1, Brian L. McGlynn1, Vincent J. Pacific1, Howard E. Epstein2, Daniel L. Welsch, Kelsey Jencso1 1.diego.riverosiregui@montana.edu; Watershed Hydrology Lab, Department of Land Resources and Environmental Sciences, Montana State University, Bozeman, MT 597172.Department of Environmental Sciences, University of Virginia, Charlottesville, VA 22904. 3. Department of Geography, Frostburg State University, Frostburg, MD 21532 INTRODUCTION SOIL RESPIRATION AND SOIL MOISTURE SOIL MOISTURE • Soil CO2 efflux is the single largest respiratory flux from forested ecosystems. Understanding its spatial and temporal dynamics will provide insight into C exchange at the ecosystem level. • Evaluating and predicting soil respiration response to changing hydrologic and biophysical conditions is currently constrained by understanding of first-order controls and the methods used to measure, model, and interpret soil respiration. • We measured soil CO2 concentration, soil CO2 flux, soil moisture, soil temperature, groundwater dynamics, and precipitation at 20-minute intervals throughout two growing seasons at 4 sites and at sub-weekly intervals at 62 sites covering the range of topographic position, slope, aspect, and land cover. • Our goal is to quantify watershed-scale heterogeneity in soil CO2 concentrations and surface efflux and gain understanding of the relative contribution of biophysical controls on soil respiration. Stringer Creek Watershed(550 ha) Transect 1 Transect 2 Increase in upslope contributing area, (downhill) Contours are every 10 m Figure 4: Triangle Topographic Index for Stringer Creek Watershed (Seibert and McGlynn, WRR 2007) based on a 3-m DEM. This is an estimate of soil wetness potential across the catchment. SPATIAL AND TEMPORAL HETEROGENEITY Figure 2: Two growing season averages of soil respiration and soil water content at 34 of 62 total sites. These comparisons highlight the relative controls of water content on controlling soil respiration across the watershed. For example, note the high variability of water content in riparian areas, whereas high uplands remain dry during most of growing season. Note how increasing upslope contributing area (i.e., moving in the downhill direction) controls total soil respiration in high, dry uplands. Error bars are one S.D. Refer to colors in Figure 1 for location. SITE A Stringer Creek(550 ha) LEGEND Soil moisture & temperature SEASONALITY IN THE SOIL [CO2]- SOIL TEMP RELATIONSHIP Biometry plots Gas wells and respiration plots Eddy covariance systems Elevation Flume 2425 m Tenderfoot CreekExperimental Forest(TCEF) 2090 m SIGNIFICANCE • Understanding linkages between the biophysical controls of soil respiration and hydrology from the point, to the plot, to the watershed scale is critical to understanding dynamics of net ecosystem CO2 exchange. • High elevation mountain landscapes play an important role in the North American carbon cycle, yet the number of studies of coupled C and water cycles in the Northern Rocky Mountains is limited. • The relative sensitivity of soil respiration to biophysical variables is poorly understood. However, catchment level studies allow comparison of magnitude and variability of biophysical controls across environmental gradients. Figure 1. (A) Current instrumentation at the TCEF includes five real-time monitoring stations for soil moisture and temperature, >60 groundwater wells and piezometers, two eddy covariance towers, and >120 gas wells. We seek to understand the effect of watershed-scale heterogeneity on CO2 distribution and flux across environmental gradients. Figure 3. (A) Relationship of soil [CO2] and soil temperature at 20-min intervals at a riparian site with pronounced summer dry-down. (B) Highlighted evolution of hysteresis throughout the summer. Soil water content values are given in parentheses for each highlighted day. (From Riveros-Iregui et al. in review) METHODS • Long-term monitoring of soil respiration, soil moisture, and soil temperature at 62 sites across the watershed. • Continuous measurements of soil respiration in riparian and upland settings. • Land cover analysis from Airborne Laser Swath Mapping (ALSM) sub-meter topographic and vegetation data. • These methods are targeted to investigate the effect of heterogeneity of biophysical controls on soil CO2 efflux at the watershed scale. MODELING SOIL CO2 Acknowledgments: This work is supported by the NSF Integrated Carbon Cycle Research Program, a Student Research Grant from the Montana Water Center and a MSU College of Graduate Studies Fellowship. We appreciate extensive logistic collaboration from the U.S. Forest Service.