Download
1 / 12
130 likes | 302 Views
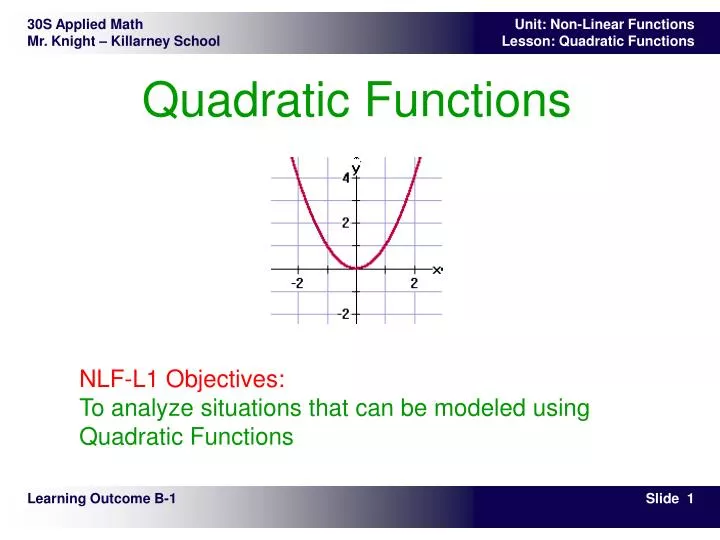
Quadratic Functions. NLF-L1 Objectives: To analyze situations that can be modeled using Quadratic Functions. Learning Outcome B-1.

E N D
Quadratic Functions NLF-L1 Objectives:To analyze situations that can be modeled using Quadratic Functions Learning Outcome B-1
You have studied linear functions and their applications in previous math courses. This module deals with non-linear functions and their applications. You will be studying quadratic, cubic, and exponential functions.Many real-world situations are modeled by these functions. The cooling rate of a cup of warm liquid, the relationship between the length of a pendulum and the time for one swing, the change in brightness of a light as you move away from it: these are all examples of situations that are modeled by non-linear functions. Theory – Non Linear Functions
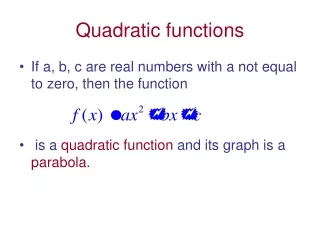
A quadratic function has a general equation of the form y = ax2 + bx + c. The shape of the graph of a quadratic function is called a parabola. It is a distinctive shape that is used in reflectors for car lights. The shape may open upward or downward. Why could a quadratic function not open left or right? Theory – Quadratic Functions
The graphs shown below are graphs of quadratic functions. • The first graph opens upward and has a minimum value for y. The lowest point on this graph is called its vertex. • The second graph opens downward and has a maximum value for y. The highest point on this graph is also called its vertex. • The vertex of a quadratic graph is the lowest or highest point on the graph. Expressed using coordinate notation, our vertex in the third graph is (2, -4). Theory – Properties of Quadratics - Vertex
The x-intercept is the point where the line meets the x-axis, and the y-intercept is the point where the line meets the y-axis. • The quadratic graph shown has two x-intercepts. It intersects the x-axis at (-3, 0) and (4, 0). Because the y-coordinate is always zero, you can simply say that the x-intercepts are -3 and 4. • Sometimes, the values of the x-intercepts are called the zeroes or roots of the function, and represent the x-values that would produce a y-value of zero. Finding the zeroes (when the y-value is zero) is sometimes called solving the equation. • The coordinates of the y-intercept are (0, 6). Similarly, you can say that the y-intercept is 6. Theory – Properties of Quadratics - Intercepts
A quadratic graph does not necessarily have two x-intercepts. It can have one x-intercept or no x-intercepts as shown below. • The y-intercept of the first graph has coordinates (0, 4) and the coordinates of the y-intercept of the second graph are (0, 1). Theory – Properties of Quadratics - Intercepts
The axis of symmetry of a quadratic graph is a line through the vertex, parallel to the y-axis. • It will always be of the form x = (x-coordinate of the vertex) • For example, the axis of symmetry of the quadratic graph shown is the vertical dashed line. The equation for the line is x = 3. Theory – Properties of Quadratics – Axis of Symmetry
The domain represents the values of x that can be used by the function. • The range represents the values of y that result. • For the graph shown below, the domain is all real numbers. The range is all real numbers greater than or equal to 0. Theory – Properties of Quadratics – Domain & Range
Example 1For the function whose graph is shown below: • The domain, the values of x that can be used by the function, is the set of all real numbers. Sometimes this is written as {all real numbers}. • The range, the values of y, is the set of real numbers less than or equal to 4.5. Sometimes this will be written as {all real numbers £ 4.5} Example – Properties of Quadratics – Domain & Range
Example 2For the function whose graph is shown below: • The coordinates of the vertex are (-1, 4). • The x-intercepts are -3 and 1. • The domain is {all real numbers}. • The range is {all real numbers £ 4}. • The equation of the axis of symmetry is x = -1. Example – Properties of Quadratics – Domain & Range
Use Winplot to answerGiven the quadratic function y = 2x2 - 4x - 1, identify the following: • the coordinates of the vertex • the coordinates of the x-intercepts (if any) • the coordinates of the y-intercept • the domain and the range • the equation for the axis of symmetry Using Winplot
The graph of y = x2 is shown. How do you think the graph would change if you graphed y = x2 + 3? How about the graph of y = x2 - 2? How would the graph change if you graphed y = 2x2?y = 0.5x2?y = -2x2?y = -3x2? How would the graph change if you graphed y = (x - 2)2?y = (x + 2)2?y = (x - 4)2?y = (x + 4)2? Using Winplot to Analyze Transformations