Download
1 / 25
280 likes | 476 Views
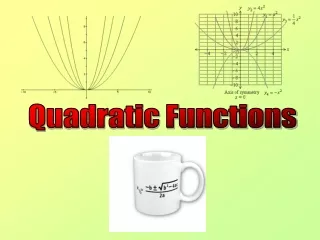
Quadratic Functions. A quadratic function is described by an equation of the following form: ax² + bx + c, where a ≠ 0 The graphs of quadratic functions are __________ All parabolas have an axis of symmetry.

E N D
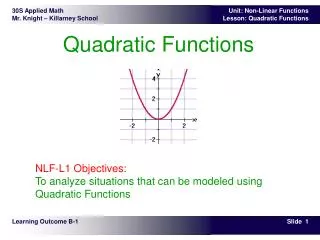
Quadratic Functions • A quadratic function is described by an equation of the following form: ax² + bx + c, where a ≠ 0 The graphs of quadratic functions are __________ All parabolas have an axis of symmetry.
The point at which the axis of symmetry intersects a parabola is called the _________.
Consider the graph of y = ax² + bx + c • The y-intercept is ___ • The equation of the axis of symmetry is • X = • The x-coordinate of the vertex is • The y-coordinate of the vertex of a quadratic function is the maximum or minimum value.
The graph of f(x)= ax² + bx + c • Opens up and had a minimum value when a > 0. Opens down and has a maximum value when a < 0. Ex:
Ways to Graph Quadratics • You can ALWAYS make a table (by picking and plugging in numbers for x, solving for y, then graphing those ordered pairs). You will need about 5 – 6 points (sometimes more) to get a good picture of what the graph should look like. or • Use the fact that parabolas are symmetrical so you don’t need so many points.
Use a table of values to graph Answer: Example 1-1a Graph these ordered pairs and connect them with a smooth curve.
Use a table of values to graph Example 1-1b Answer:
Use a table of values to graph Answer: Example 1-2a Graph these ordered pairs and connect them with a smooth curve.
Use a table of values to graph Example 1-2b Answer:
Graph Using Vertex and Axis of Symmetry Step 1: Write the equation of the axis of symmetry using the formula (remember x = # is a vertical line through that number)
Graph Using Vertex and Axis of Symmetry Step 2: Find the coordinates of the vertex by plugging in the x value you just found and solving for y. Step 3: Decide if the vertex is a • Maximum and opens down because the x² term is negative or • Minimum and opens up because the x² term is positive
Graph Using Vertex and Axis of Symmetry Step 4: Graph the function • Plot the vertex • Graph the axis of symmetry vertical line • Choose a value for x not on the axis of symmetry, plug it in and solve for y. Graph this point and then use the axis of symmetry to graph the “same” point on the other side of the axis. • Repeat this once to get another two points, then sketch the parabola.
Consider the graph of Write the equation of the axis of symmetry. In Equation for the axis of symmetry of a parabola and Answer: The equation of the axis of symmetry is Example 1-3a
Consider the graph of Find the coordinates of the vertex. Original equation Simplify. Add. Example 1-3b Since the equation of the axis of symmetry is x = –2 and the vertex lies on the axis, the x-coordinate for the vertex is –2. Answer: The vertex is at (–2, 6).
Example 1-3c Identify the vertex as a maximum or minimum. Answer: Since the coefficient of the x2 term is negative, the parabola opens downward and the vertex is a maximum point.
Original equation Simplify. Example 1-3d (–2, 6) Graph the function. You can use the symmetry of the parabola to help you draw its graph. On a coordinate plane, graph the vertex and the axis of symmetry. Choose a value for x other than –2. For example, choose –1 and find the y-coordinate that satisfiesthe equation.
Example 1-3e (–2, 6) Graph the function. Graph (–1, 4). (–3, 4) (–1, 4) Sincethe graph is symmetrical about its axis ofsymmetry x = –2, you can find another point on the otherside of the axis of symmetry.The point at (–1, 4) is 1 unit to the right of the axis.Go 1 unit to the left of the axisand plot the point (–3, 4).
Example 1-3f (–2, 6) Graph the function. Repeat this for several other points. (–3, 4) (–1, 4) Then sketch the parabola. (–4, –2) (0, –2)
Consider the graph of a. Write the equation of the axis of symmetry. b. Find the coordinates of the vertex. c. Identify the vertex as a maximum or minimum. Example 1-3g Answer: Answer: Answer:
Consider the graph of Example 1-3h d. Graph the function. Answer:
Multiple-Choice Test Item Which is the graph of A B C D Example 1-4a
Solve the Test ItemFind the axis of symmetry of the graph Equation for the axis of symmetry and Example 1-4b Read the Test ItemYou are given a quadratic function, and you are asked to choose the graph that corresponds to it.
Example 1-4c The axis of symmetry is –1. Look at the graphs. Since only choices C andD have this as their axis of symmetry, you can eliminate choicesA and B. Since the coefficient of the x2 term is negative, the graph opens downward. Eliminate choiceC. Answer: D
Multiple-Choice Test Item Which is the graph of A B C D Example 1-4d Answer:
Summary • How can you always graph a quadratic equation? • How does the axis of symmetry help us graph? • When will you have a maximum vertex? Which way does it open? • When will you have a minimum vertex? Which way does it open? • Assignment: pg 528: 1-9, 11, 15