Download
1 / 35
380 likes | 1.02k Views
Diagnostic and theragnostic cerebrospinal fluid biomarkers for Alzheimer’s disease. Kaj Blennow, Gothenburg University, Sweden. Need of biomarkers for Alzheimer’s disease. Improve diagnostic accuracy - Clinical practice - Clinical trials

E N D
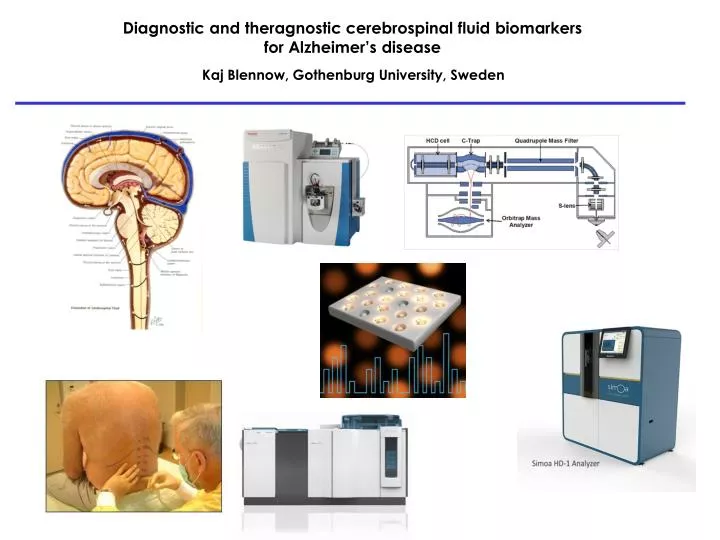
Diagnostic and theragnostic cerebrospinal fluid biomarkers for Alzheimer’s disease Kaj Blennow, Gothenburg University, Sweden
Need of biomarkers for Alzheimer’s disease Improvediagnosticaccuracy - Clinical practice - Clinical trials •Correctclinicaldiagnosisonly in 70-80% of cases Studymolecularpathogenesisdirectly in patients •Verify data from cellular and animal models Theragnostics – identify and monitor drugeffects • Target engagement • Drug effects on downstreampathology
Total tau Neuronal / axonal degeneration Phospho tau Phosphorylation state of tau / development of tangles Aβ42+40 b-amyloid metabolism / development of senile plaques Candidate CSF biomarkers for Alzheimer’s disease
T T T T T T T T T T T S S S S S S S S S S S S S S S S S S S S S S S S BT2 HT7 AT120 The three established ELISA methods for AD CSF biomarkers 300% increase in AD 85% sensitivity Mol Chem Neuropathol 1995 3D6 42 b-amyloid 1 21F12 50% decrease in AD 90% sensitivity Arch Neurol 1999 AT270 HT7 2-300% increase in AD Highest specificity
The AlzBiomarkerdatabase • Online database for CSF biomarkers T-tau, P-tau and Aβ42 + top candidates • All published papers with: A) patient + control group B) > 10 cases Henrik Zetterberg, Bob Olsson, and colleagues • Ratio AD/control (mean + 95% CI) … 90 more studies… … 100 more studies…
Multiplex immunoassay for AD CSF biomarkers • Luminex values correlates well with ELISA values • Difference in absolute levels
Can CSF biomarkers identify prodromal AD ? Follow-up study on MCI (>4 years) CSF samples taken at baseline MCI n= 134 57 MCI AD 56 MCI MCI 21 MCI other dem. Controls n = 37 Cut-off: T-tau >350 pg/mL + A42 / P-tau ratio < 6.5 Sensitivity MCI AD 95 % Specificity MCI MCI + other 87 % Hazard ratio : 25.5 (7.7 – 84.9)
Multi-center studies verify that CSF assays can identify prodromal AD DESCRIPA – Europe • ”AD profile” predicts prodromal AD - OR 26.8 ADNI – US • ”AD profile” in 89% of prodromal AD cases Swedish Brian Power – Europe + US • ”AD profile” - 88% specific for prodromal AD
How early will CSF Aβ42 signal ? Baseline - CSF from 86 cognitively normal (CDR = 0, MMSE = 28.4) 13 yearfollow-up - 16 with dementia (13 AD) - 70 normal (CDR =0) 1400 1200 1000 800 600 400 200 0 CSF Aβ42 Median Aβ42 831 pg/mL 0 200 400 600 800 1000 1200 1400 CSF T-tau • 14 / 16 who developed dementia (13 AD) had low baseline CSF Aβ42 Sensitivity for AD - 93 % • 2 / 41 with high baseline CSF Aβ42 levels developed dementia (both VaD) Specificity for AD - 100 % • Low CSF Aβ42 highly predictive of future AD dementia Skoog, Kern et al, unpublished
Will the AD CSF biomarkers work in clinical practice ? • All consecutive patients (n= 241) during 1 year • Analyses performed week by week in clinical routine • Re-analysis of 41 samples on 1 ELISA plate CSF Aβ42 CSF T-tau ► CSF biomarkers may be implemented in clinical routine using a central Lab
The Alzheimer’s Association QC program for CSF biomarkers Principle for the QC program: For each round, 3 QC samples (pooled CSF) are sent out 2 unique samples - for comparisons between labs 1 identical sample - for comparisons over time Frequency: 3 times per year > 90 labs Variabilitybetweenlabs and between ELISA batches - need of standardization efforts
The IFCC Work Group for CSF proteins Reference Measurement Procedure (RMP) High precision Mass spectrometry-based technique Golden standard method for absolute quantification Certified calibrator (amino acid analysis) Tested in Round Robin studies Intended use Set level in the Certified Reference Material Certified Reference Material (CRM) Large aliquoted CSF pool Golden standard CSF with exact levels Exact level set using RMPs Commutability between assays tested Tested for long-term stability etc. Intended use Distribution to kit vendors and large labs Harmonize CSF levels between assay formats Assure stability between production lots
Reference method for CSF Aβ42 - Validated ”Golden standard” method • Antibody-free Single Reation Monitoring (SRM) Triple Quad mass spec method for CSF Aβ isoforms Separation of Aβ by HPLC Elute + dry + redissolve in ACN and NH4OH SPE antibody-free purification Vantage Triple Quad mass spectrometry Aβ1-40 CSF + internal Aβ standards Guanidine HCl denaturation Endogenous Aβ Aβ standards Aβ1-38 Aβ1-42 5.5 6.0 6.5 7.0 7.5 Time (min) Quantification of Aβ isoforms • Isotope labelled Aβ calibrator added to the CSF sample (and thus processed identically) • No antibodies involved absolute quantification without interference (matrix effects)
Round Robin study on SRM Triple Quad Aβ42 By the Global Biomarker Standardization Consortium • Four laboratories with SRM methods for CSF Aβ42: University of Gothenburg University of Pennsylvania PPD, USA Waters, USA • 12 CSF samples analyzed • One CSF served as a Candidate Reference Material Value for Individual lab Mean of all labs • SRM mass spec suitable as a Reference Measurement Procedure (RMP) for CSF Aβ42
Certified Reference Material (CRM) for CSF Aβ42 • Large pool (5.0 L) of CSF collected • Tested for interference among individual samples in mixing matrix • 32 individual CSF samples run in duplicates (chosen to cover the clinical analytical range) • Aβ candidate reference material: Neat CSF pool Spiked - low, medium, high • Aβ used for spiking determined by amino acid analysis
The end of the road: CSF biomarker assays on fully automated clinical analyzers • • Fully automated - minimize variations due to differences in laboratory procedures • - minimal between-batch variations (2-4%) • Will allow uniform cut-off levels • Single sample analysis fast results (< 30 min) to the clinician Roche Diagnostics –Cobas Fujirebio - Lumipulse
Biomarker-baseddiagnostic research criteriafor AD • Impairment in episodic memory Plus one or more of • CSF - low Aβ42, high T-tau or P-tau • PET - high cortical amyloid ligand uptake Need of studies on how the AD biomarkers complement each other and can be combined
How do amyloid PET and CSF Aβ42 compare ? Study design: 118 patients with cognitive complaint examined for both CSF biomarkers - as part of clinical routine – 2 years and amyloid 18F-flutemetamol PET Cut-offs: CSF Aβ42 < 647 pg/mL 18F-flutemetamol PET > 1.42 Validation cohort n= 38 Original cohort n= 118 Positive PET+CSF or Negative PET+CSF 97 % Positive PET+CSF or Negative PET+CSF 92 % Palmquist S, et al, JAMA Neurol 2014 in press
Will regional cortical amyloid PET give complementary information to CSF Aβ42 ? Study design: ADNI-2 study (192 controls, 172 AD and 202 MCI) Examined for: CSF Aβ42 levels Amyloid 18F-florbetapir PET - global and regional cortical SUVr 192 Controls vs. 172 AD 132 stable MCI vs. 70 progressive MCI CSF Aβ42 gives similar diagnostic information as global and regional amyloid PET Mattsson N, et al, Ann Clin TranslNeurol2014 in press
Aβ40 Aβ17 0.8 Aβ15 Aβ38 Aβ39 MAb 6E10 0.6 Aβ16 Aβ14 Aβ19 Aβ12 Intens. [a.u.] Aβ34 Aβ13 Aβ18 0.4 Aβ37 Aβ30 Aβ33 Aβ42 Aβ20 Aβ23 0.2 0.0 m/z 1500 2000 2500 3000 3500 4000 4500 Protein processing evaluated by targeted proteomics - the key to novel AD CSF biomarkers ? Immunoprecipitation – MALDI-TOF analysisof Aβ in CSF Experimental studies with ex-vivo 18O-labelling show that these Aβspecies are not produced by proteolytic degradation in CSF
Can we identify biomarkers and develop assays to monitor synaptic dysfunction ? Vantage Triple Quad mass spectrometry • Synaptic proteins in CSF: • Likely to correlate with cognitive function • May give clues to AD pathogenesis in clinical studies • May be important in trials to monitor effect on synaptic degeneration Separation of Aβ by HPLC Addsample capture SNARE complex proteins Addknownamount of Isotope-labelledpeptide standard Cleave proteins with trypsin Wash Magnetic beads with anti-SNAP25 antibody SRM Triple Quad mass spec method for CSF SNAP-25
SRM Triple Quad method for CSF SNAP-25 peptides N-terminal (tryptic) peptides are present in CSF: SNAP-25 Ac 2-16, 17-31, and 32-40 which come from SNAP-25 2-46 Cohort: AD dementia (n= 10) and non-demented controls (n= 6) from Sweden
Will CSF SNAP-25 peptides be useful to identify prodromal AD? Cohort: AD dementia (n= 9), prodromal AD (n= 7) and controls (n= 9) from Germany • N-terminal SNAP-25 is a candidate biomarker for AD and prodromal AD
CSF neurogranin as a biomarker for dendritic degeneration in AD • Abundant in cortex, hippocampus, amygdala • Concentrated in dendriticspines • Important for synapticsignalling and LTP induction Pilot CSF study: Immpunprecipitation (1.5 mL CSF) / Western blot
Neurogranin - as a possible CSF biomarker for synaptic function ? Neurograninmonocloncals MDCCTENACSKPDDDILDIPLDDPGANAAAAKIQASFRGHMARKKIKSGERGRKGPGPGGPGGAGVARGGAGGGPSGD NG2 NG7 NG3 x10 CSF IP-MALDI NG43-75 4 NG44-75 3 NG 43-75 RKKIKSGERGRKGPGPGGPGGAGVARGGAGGGP Intens. [a.u.] 2 NG 44-75 KKIKSGERGRKGPGPGGPGGAGVARGGAGGGP NG41-75 NG43-65 NG43-78 NG46-75 NG48-75 NG44-78 1 NG 46-75 NG40-75 • Neurogranin in CSF are present as C-terminal peptides • These are not produced by proteolysis in CSF • Minute amounts of full-length protein NG45-75 IKSGERGRKGPGPGGPGGAGVARGGAGGGP 0 2200 2400 2600 2800 3000 3200 3400 3600 m/z
CSF Neurogranin as a biomarker for Alzheimer’s disease Ratio CSF Neurogranin/Aβ42 CSF Neurogranin ELISA 2000 1500 p < 0.0001 CSF Ng (pg/mL) 1000 Rs = 0.70 P < 0.0001 2.5 500 2.0 0 CSF tau (pg/mL) D o 1500 A C 1.5 Ng (ELISA) / Aβ1-42 (ratio) 1000 1.0 500 CSF neurogranin (pg/mL) 0.5 0 0.0 0 500 1000 1500 Control MCI-AD MCI-MCI • C-terminal neurogranin is a candidate biomarker for synaptic function and degeneration in AD
Stability of CSF biomarkers over time AD cases (n= 53), 6 month Treatment with AChE inhibitors Healthy elderly (n= 10), 24 hour lumbar catheter study A42 A42 1400 4000 CV 5.2% 1200 CV 8.9% 1000 3000 800 pg/mL Follow-up 2000 600 400 1000 200 0 0 0 200 400 600 800 1000 1200 0 10 20 Hours Baseline → CSF biomarkers are stable over time – short term (24 h.) and long-term (6 months) → opens the possibility to detect small drug effects on CSF biomarker levels Blennow et al. NeurosciLett2007 Bjerke et al. J Alzheimer Dis 2010
APP and Aβ as primary biomarkers in BACE1 inhibitor trials Study design: Phase I study on healthy volunteers Single dose of LY2811376 BACE inhibitor Continuous CSF and plasma sampling Plasma Aβ1-40 CSF Aβ1-40 CSF sAPPα CSF sAPPβ May PC, J. Neurosci. 2011
CSF biomarkers in passive Aβ immunotherapy trials CSF T-Tau CSF P-Tau p=0.027 100 5 Phase II bapineuzumab trial p=0.0013 50 0 p=0.0305 0 -5 Change at Week 54 (pg/ml) Change at Week 54 (pg/ml) -50 -10 -100 Blennow K, et al, Arch Neurol 2012 -150 -15 Bapineuzumab Placebo Bapineuzumab Placebo Phase III bapineuzumab trial Salloway S, et al, NEJM 2014
Targeted proteomics of Aβisoforms with BACE1 inhibitors Cell-culture studies on APP transfected cells Treatment with different BACE1 inhibitors (BACE IV, AZ-20) + BACE1 siRNA • Marked reduction inAβ 1-38, 1-40, 1-42 • Appearance of Aβ 5-38, 5-39, 5-40 and 5-42
Phase I BACE1 inhibitor trial in man • Study design: Singledosetreatment with a BACE1 inhibitor • Healthyvolunteers • CSF samples at baseline + 6 – 12 – 18 – 24 – 36 hours • Analysis of Aβ species in CSF by IP-MALDI Aβ1-33 0 hrs Aβ1-34 1.5 12 hrs Aβ 5-40 1.0 Relative MALDI signal/% 24 hrs 0.5 36 hrs 0.0 0 10 20 30 40 Time (hours) Placebo 3600 3650 3700 3750 3800 3850 3900 30 mg 90 mg Portelius et al, submittedmanuscript
Is there a difference in aggregation tendency between Aβ 1-42 and Aβ 5-42 ? Aβ 5-42 has higher aggregation tendency than Aβ 1-42