Download
1 / 51
510 likes | 696 Views
Semi-Stationary Waves Masquerading as Stationary Waves in the Martian Atmosphere . Tamara McDunn 1 Advisor : David Kass 1 1 Jet Propulsion Laboratory, California Institute of Technology JPL Postdoc Seminar, June 27, 2013 CL#13- 1687

E N D
Semi-Stationary Waves Masquerading as Stationary Waves in the Martian Atmosphere Tamara McDunn1 Advisor: David Kass1 1Jet Propulsion Laboratory, California Institute of Technology JPL Postdoc Seminar, June 27, 2013 CL#13-1687 (c) 2013 California Institute of Technology. Government sponsorship acknowledged.
Outline • Background on stationary waves at Mars • Mars Climate Sounder dataset • Traditional analysis and its limitation • Behavior of wavenumber-2 semi-stationary waves at Mars • Conclusions • Future Work
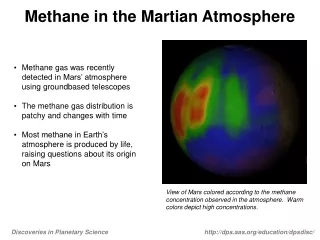
Background Waves are a fundamental feature of an atmosphere on a rotating body; they drive atmospheric behavior and can be used as a diagnostic of that behavior 7 martianyears of nearly-continuous lower-atmosphere (surface to ~50 km) observations Seasonal behavior of large-scale (planetary) waves has been well-explored using orbital observations; short-timescale behavior has not
Stationary Waves Waves with zero temporal frequency in the zonal direction (W-E) Forced by flow over topography and zonal inhomogeneities in thermal forcing Phase is approximately constant with height and season On Earth they often generate clouds
Effects of Stationary Waves on Earth Redistribute heat from low to high latitudes Reduce atmospheric stability (resistance to vertical motion) Deposit momentum at high altitudes leading to acceleration/deceleration of the mean flow
Behavior of Stationary Waves at Mars Amplitudes peak during local fall and winter Amplitudes peak at mid-latitudes (edge of circumpolar jet) Dominant zonal wavenumber is driven by form of topography at jet latitudes Track edge of polar vortex (move poleward with height) Same effects as stationary waves on Earth
Model: Mars Climate Database Suite of simulations from a general circulation model [Lewis et al. 1999] Horizontal resolution: 3.75° x 5.625° Vertical resolution: variable (12 layers in lowest scale height, ~1/3 scale height to ½ scale height above that) Forced with moderate solar input Forced with climatological distribution of suspended dust (TES year 1)
Outline Background on stationary waves at Mars Mars Climate Sounder dataset Traditional analysis and its limitation Behavior of wavenumber-2 semi-stationary waves at Mars Conclusions Future Work
Mars Climate Sounder (MCS) Instrument Description Thermal Blankets Elevation Actuator ParameterProperty / Performance Instrument Type Filter Radiometer Spectral Range & Channels 0.3 to 50.0 µm in nine spectral channels Telescopes Two identical, 4cm aperture, f/1.6 telescopes Detectors Nine, 21-element, linear thermopile arrays at 300 K Fields-of-View Detector IFOV: 3.6 x 6.2 mrad 5.0 x 8.6 km (At Limb) Instrument IFOV: 75 x 75 mrad 105 x 105 km (At Limb) Instrument Articulation Two-axis azimuth/elevation Range/Resolution: Azimuth: 270/0.1 degrees Elevation: 270/0.1 degrees Operation Modes Single Operating Mode, 2 s signal integration period Observation Strategy Limb Staring; Limb, nadir & off-nadir scanning In-track, Cross-track, and Off-track viewing Telescopes Limb Azimuth Yoke Solar Target Nadir Blackbody Targets Azimuth Actuator
MCS Spectral Channel Characteristics Telescope/ Bandpass Band Measurement Function Channel # cm-1 Center - µm A1 595 - 615 16.5 Temperature 0-20 km A2 615 - 645 15.9 Temperature 20-40 km, Pressure A3 635 - 665 15.4 Temperature 40-80 km, Pressure A4 820 - 870 11.8 Dust and Condensate (D&C) extinction 0-80 km A5 400 - 500 22.2 D&C extinction 0-80 km A6 3300 - 33000 1.65 Polar Radiative Balance B1 290 - 340 31.7 Surface Temperature, D&C extinction 0-80 km B2 220 - 260 41.7 Water Vapor 0-40 km, D&C extinction 0-80 km B3 230 - 245 42.1 Water Vapor 0-40 km, D&C extinction 0-80 km
MCSDataset McCleese et al., 2007; Kleinböhl et al., 2009; 2011 Retrieved profiles: p, T, water ice, dust Surface to 80-90 km (5 km resolution) Sun-synchronous, fixed, high-inc., polar orbit 3 am and 3 pm T uncertainty ~ 2 K
MCS Investigation Timeline 9.5 9.0 8.5 8.0 7.5 7.0 6.5 6.0 9.5 9.0 8.5 8.0 7.5 7.0 6.5 6.0 9.5 9.0 8.5 8.0 7.5 7.0 6.5 6.0 9.5 9.0 8.5 8.0 7.5 7.0 6.5 6.0 Pressure – mbar Pressure – mbar Pressure – mbar Pressure mbar 0 30 60 90 120 150 180 210 240 270 300 330 360 Areocentric Longitude of the Sun (Ls) - Degrees
Outline Background on stationary waves at Mars Mars Climate Sounder dataset Traditional analysis and its limitation Behavior of wavenumber-2 semi-stationary waves at Mars Conclusions Future Work
Traditional Analysis e.g., Banfield et al, 2003; Lee et al, 2009 Step 2: Take spatial Fourier Transform local-time wavenumber zonal wavenumber temporal frequency Step 1: Compute Tavgand Tdiff Tavg = T3am + T3pm 2 m = |s – σ| Tdiff = T3am - T3pm 2
Result of Traditional Analysis Tavg Tdiff Ls= 285°, Lat = 45° N, and p = 106 Pa Wave Amplitude (K) Local-time wavenumber Local-time wavenumber
Limitation of Traditional Analysis Ls = 285 LT = 03 LT = 15 Latitude Latitude m = 2 iisstrong on the nightside but, disappears on the dayside
Outline Background on stationary waves at Mars Mars Climate Sounder dataset Traditional analysis and its limitation Behavior of wavenumber-2 semi-stationary waves at Mars Conclusions Future Work
Local-time Behavior (from model) LT = 00 Pressure (Pa)
Local-time Behavior (from model) LT = 01 Pressure (Pa)
Local-time Behavior (from model) LT = 02 Pressure (Pa)
Local-time Behavior (from model) LT = 03 Pressure (Pa)
Local-time Behavior (from model) LT = 04 Pressure (Pa)
Local-time Behavior (from model) LT = 05 Pressure (Pa)
Local-time Behavior (from model) LT = 06 Pressure (Pa)
Local-time Behavior (from model) LT = 07 Pressure (Pa)
Local-time Behavior (from model) LT = 08 Pressure (Pa)
Local-time Behavior (from model) LT = 09 Pressure (Pa)
Local-time Behavior (from model) LT = 10 Pressure (Pa)
Local-time Behavior (from model) LT = 11 Pressure (Pa)
Local-time Behavior (from model) LT = 12 Pressure (Pa)
Local-time Behavior (from model) LT = 13 Pressure (Pa)
Local-time Behavior (from model) LT = 14 Pressure (Pa)
Local-time Behavior (from model) LT = 15 Pressure (Pa)
Local-time Behavior (from model) LT = 16 Pressure (Pa)
Local-time Behavior (from model) LT = 17 Pressure (Pa)
Local-time Behavior (from model) LT = 18 Pressure (Pa)
Local-time Behavior (from model) LT = 19 Pressure (Pa)
Local-time Behavior (from model) LT = 20 Pressure (Pa)
Local-time Behavior (from model) LT = 21 Pressure (Pa)
Local-time Behavior (from model) LT = 22 Pressure (Pa)
Local-time Behavior (from model) LT = 23 Pressure (Pa)
Daily Maximum and Minimum(from model) Ls = 285 Daily Maximum m = 2 Amplitude Daily Minimum m = 2 Amplitude LT = 00 am LT = 11 am (K) Pressure (Pa)
Latitudinal Behavior (from MCS) T3am , Ls = 285 T3am m = 2 peaks at mid-latitudes and is vertically confined to p ~ 80-150 Pa
Seasonal Behavior (from MCS) • Latitude = 30-40 N Latitude = 40-50 N T3am m = 2 at higher latitudes is greater at local fall T3am m = 2 at lower latitudes is greater at local winter
Interannual Behavior (from MCS) Spatial extent varies, but m = 2 exists during all 3 Mars Years MY 28 MY 29 MY 30
Associated with negative phase of Meridional (S-N) Winds (from model) Ls = 285, p = 106 Pa LT = 00 am LT = 11 am
Outline Background on stationary waves at Mars Mars Climate Sounder dataset Traditional analysis and its limitation Behavior of wavenumber-2 semi-stationary waves at Mars Conclusions Future Work
Conclusions Semi-stationary waves are those that exhibit Stationary behavior • Tavg and Tdiff analyses consistent with m = s = 2 waves • Peak during fall and winter • Zonal form matches that of the topography at mid-latitudes • Positive phase is in the Leeof Tharsis and Elysium mountain ranges • Phase is nearly constant with season and height (not shown) Non-stationary behavior • Local-time variability • strongest near local midnight • weakest near local noon • Correlation with the semidiurnal tide in the v wind field • Unstable region aloft (not shown)
Future Work: Explore Implications for Atmosphere • Storm Tracks -Positive phase correlated with storm tracks? - Profiles through the positive phase show no significant correlation with dust opacity • Clouds - Profiles through the negative phase show no significant correlation with water ice opacity - But, negative phase is correlated with increased nightside column-integrated water ice clouds [Benson et al., 2011] • Aerosol Transport -Positive phase correlated with channels of transport?