Download
1 / 94
1.05k likes | 1.23k Views
Spectrophotometer. Updated 9/27/2006. I. Outline . Spectrophotometry Defined Electromagnetic Scale Waves defined Human Eye Molecules and Light Absorption and Reflection Spectrophotometer. A. Spectrophotometry Defined. Quantifies a given sample in a solution

E N D
Spectrophotometer Updated 9/27/2006
I. Outline • Spectrophotometry Defined • Electromagnetic Scale • Waves defined • Human Eye • Molecules and Light • Absorption and Reflection • Spectrophotometer
A. Spectrophotometry Defined • Quantifies a given sample in a solution • Concentration in a volume of solution • Spectro=sight • Photo=light waves • Metry=measurement
Types of Electromagnetic Radiation B. Electromagnetic Scale
C. Waves λ
Crest midpoint trough • Crest: High point in the wave • Trough: Low point in the wave • --------Midpoint of wavewhere the wave is in equilibrium • Amplitude Distance from the midpoint to the crest or trough • The higher the amplitude the stronger the wave
Light waves λ λ λ
The wave length of electromagnetic radiation varies greatly depending on its type. • X-ray are measured in nanometers, whereas, radio waves 10,000 meters.
They also vary in the amount of energy they carry. • The shorter the wavelength, the more energy is carried by it. • X-ray have very short wavelengths and carry a great deal of energy. Radio waves have long wavelengths and photons with much less energy
D. Human Eye & Vision • 380 – 430nm Violet • 430 – 475nm Blue • 505 – 555nm Green • 575 – 600nm Yellow • 600 – 650 nmOrange • 650 – 780nm Red
1. Sensing Light Humans have two light detectors. Do you know what they are called? Rods and Cones!!!
Color Vision • Cones • Current understanding is that the 6 to 7 million cones can be divided • into "red" cones (64%), "green" cones (32%), and "blue" cones (2%)
Rods • not sensitive to color. • They are responsible for our dark-adapted, or scotopic, vision (night vision) • Sensitive to light. • The rods are incredibly efficient photoreceptors. More than one thousand times as sensitive as the cones, they can reportedly be triggered by individual photons under optimal conditions.
Every material has a particular arrangement of electrons and of bonds involving electrons. f. Materials
Colors of Objects Violet Indigo Blue Green Yellow Orange Red
The color of an object is determined by which wavelengths of light it reflects. • If the object absorbs light of a particular color, then that color does not reach our eyes when we look at that object.
Colors of Objects Violet Indigo Blue Green Yellow Orange Red
Colors of Objects Violet Indigo Blue Green Yellow Orange Red
The color of an object is determined by which wavelengths of light it absorbs. If the object absorbs light of a particular color, then that color does not reach our eyes when we look at that object. • An object appears orange if it absorbs all the colors except orange.
Colors of Objects Violet Indigo Blue Green Yellow Orange Red
Absorption of Light by a Solution of RED Food Coloring Incoming light= green solution appears red or red-orange.
The Absorption of Light of Particular Wavelengths and Color of Solutions Wavelength λColor Solution 380 – 430nm VioletYellow 430 – 475nm BlueOrange 505 – 555nm GreenRed 575 – 600nm YellowViolet 600 – 650nmOrange Blue 650 – 780nm Red Green
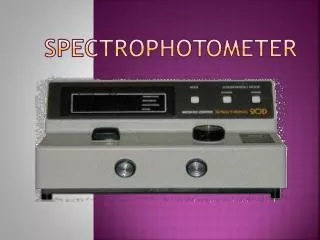
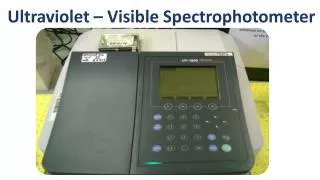
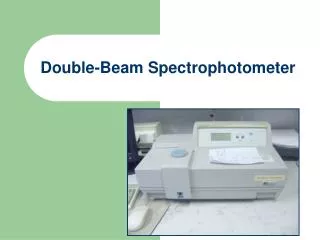
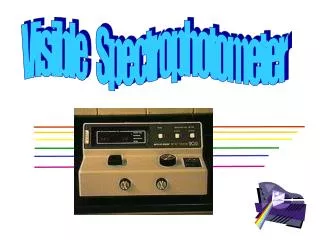
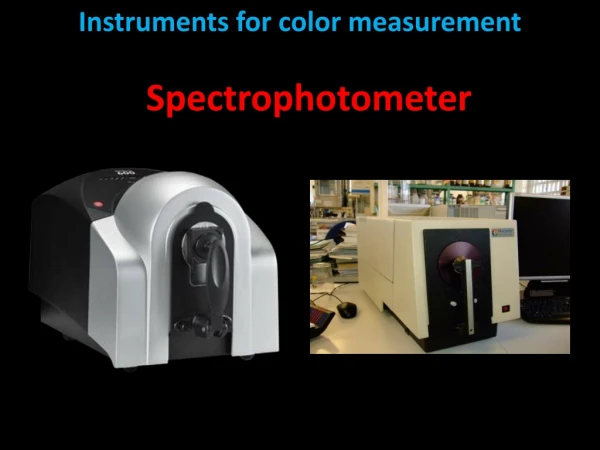
Spectrophotometer Used to measure the effect of a sample on a beam of light. Updated 9/30/2005
Blank • The blank contains the solvent and any reagents that are added to the sample.
Sample • Well-mixed • No air bubbles • No particulate • Avoid fingerprints on cuvette
%Transmittance • The ratio of the amount of light transmitted through a sample to that of the blank t = Light transmitted through sample Light transmitted through blank
First, the intensity of light (I0) passing through a blank is measured. T for transmittance • The intensity is the number of photons per second. • The blank is a solution that is identical to the sample solution except that the blank does not contain the solute that absorbs light. • This measurement is necessary, because the cell itself scatters some of the light.
Second, the intensity of light (I) passing through the sample solution is measured. • (In practice, instruments measure the power rather than the intensity of the light. • The power is the energy per second, which is the product of the intensity (photons per second) and the energy per photon.) • E=hf or hc/λ; c is the speed of light and h is 6.63 x 10⁻³⁴ E is the energy of one photon
Third, the experimental data is used to calculate two quantities: the transmittance (T) and the absorbance (A).
Transmittance • If t ≤ 1 (less than or equal to) then the amount of light transmitted through the sample is less than the blank. • In another situation, where both the sample and the blank transmit the same amount of light t = 1 • In a sample that transmits no light at all then t = 0 Transmittance range 0 to 1
Percent Transmittance %T = t x 100% • When both the sample and the blank transmit the same amount of light . %T = 100% • When a sample transmits no light at all the %T = 0%
transmission- pass without interaction through the material. Absorption- gives up some or all of its energy to the material. Light energy is converted to heat energy.
Absorbance or Optical Density (OD) • Amount of light absorbed by the sample. A = -log 10 (t) 1.6 or 1.6A or 1.6 AU or OD 1.6
Relationship between %Transmittance and Absorbance of Light and Concentration of Analyte. A ↑ = t ↓ Absorbance (A) Percent Transmittance (%T) Concentration Concentration
Recording Absorbance A260 = 1.6 Absorbance of 1.6 was measured at a wavelength of 260 nm
This compound has an absorbance peak in the greenish-blue region of the spectrum. So this solution would be orange. It is the dye Orange G. Orange GC16H10N2O7S2Na2
What if the solution is clear? • Can you measure the absorbance? • Yes • The material may not absorb light in the visible range of the EM spectrum. • Proteins and nucleic acid absorb in the UV range of EM Spectrum
Riboflavin Every material has a particular arrangement of electrons and of bonds involving electrons.
Riboflavin Riboflavin
Protein DNA