Download

1 / 14
140 likes | 267 Views
Fabian Große 1 *, Johannes Pätsch 2 and Jan O. Backhaus 2 1 Research Group Scientific Computing, Department of Informatics, University of Hamburg 2 Institute of Oceanography, University of Hamburg * Corresponding author: fabian.grosze@zmaw.de.

E N D
Fabian Große1*, Johannes Pätsch2 and Jan O. Backhaus2 1 Research Group Scientific Computing, Department of Informatics, University of Hamburg 2 Institute of Oceanography, University of Hamburg * Corresponding author: fabian.grosze@zmaw.de ParameterisingPrimary Production and Convection in a 3D Model
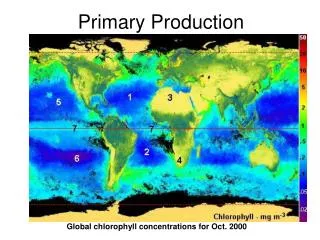
Introduction: ARGO measurements Source: Quadfasel (unpublished) Source: Quadfasel (unpublished) • convection as driving mechanism (Backhaus et al., 1999)
Introduction: Phytoconvection • mean spatial aspect ratio of 2.5:1 (horizontal vs. vertical scale) (Kämpf & Backhaus, 1998) • convective cycle takes 1-2 days (D’Asaro, 2008) • same probability of residence in the euphotic zone for each phytoplankton particle Source: Backhaus (2003) MLD 2.5:1 MLD Source: Janout (2003)
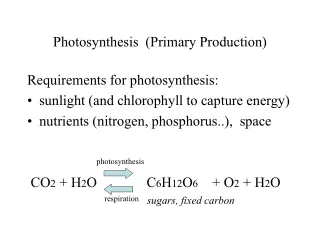
Phytoconvection in a 3D Model • Phytoconvection = upward and downward displace-ment of phytoplankton within a convective cell • hydrostatic approximation requires parameterisation • Steele (1962): PB … growth rate • MLD-dependent sliding function between standard and phytoconvection
Model Setup and Simulations • 3D physical-biogeochemical model ECOHAM4 (Lorkowski et. al., 2012) • 20 km horizontal resolution • 5-1000 m vertical resolution (24 layers) • physics initialised from climatology • initialisation for biochemistry from standard simulation of 1995 • simulation period: 1996 • comparison of 2 simulations: • Standard • Phytoconvection position of 1D analysis
Results – Part I: 1D Analysis • Standard run • low winter concentrations within mixed layer • near-surface bloom in April • high concentrations until autumn within mixed layer mg chl-a m-3 depth [m] MLDsim chlorophyll-a • Phytoconvection run • high winter concentrations within mixed layer • deep maximum in April • high concentrations until autumn within mixed layer mg chl-a m-3 depth [m] chlorophyll-a
Results – Part I: 1D Analysis mg chl-a m-3 depth [m] MLDsim MLDsim chlorophyll-a MLDobs depth [m] mg chl-a m-3 depth [m] chlorophyll a [mg m-3] chlorophyll-a Data source: BODC
Results – Part I: 1D Analysis • Standard run: • significantly lower concentrations throughout whole water column • Phytoconvection run: • upper layer concentrations in good agreement with observations • low chlorophyll-a below mixed layer • depth of chlorophyll-a gradient ≠ MLD MLDsim MLDsim MLDobs MLDobs depth [m] chlorophyll a [mg m-3] Data source: BODC
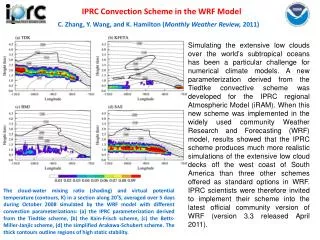
Results – Part II: 3D analysis Primary production April - standard Chlorophyll-a (depth-integrated) April - standard g C m-2 month-1 mg chl-a m-2 April - phytoconvection April - phytoconvection g C m-2 month-1 mg chl-a m-2
Results – Part III: Carbonfluxes Air-sea flux mmol C m-2 month-1 Export(below 500m) mmol C m-2 month-1
Summary & Conclusion • parameterisation of phytoconvection: • observed upper layer chlorophyll-a concentrations reproduced • strong influence of convection on primary production and carbon export production • sliding function allows continuous transition from winter to summer regime • problems during decline of mixed layer in spring • applied MLD criterion (Tsurf – T > 0.4K) not suitable to: • detect haline stratification • distinguish between convective and frictionional mixing
Outlook • improvement of sliding function: → include turbulent mixing depth (Taylor & Ferrari, 2011) • replace MLD criterion (Tsurf – T > 0.4K) • apply parameterisation on model area with more regions of deep winter convection for better data basis • include results from tank experiments investigating phytoplankton adaptation to different dark-light cycles
Titelmasterformat durch Klicken bearbeiten Vielen Dank für Ihre Aufmerksamkeit. Thank you for your attention. fabian.grosze@zmaw.de Parametrisierung von Primärproduktion und winterlicher Konvektion in einem 3D Modell 45th Liège Colloquium May 13 – 17, 2013
References • D’Asaro, Eric A.. Convection and the seeding of the North Atlantic bloom. Journal of Marine Systems, 69:233–237, 2008. • Backhaus, J., Wehde, H., Hegseth, E., and Kämpf, J. ‘Phyto-convection’: the role of oceanic convection in primary production. Marine Ecology. Progress Series, 189:77–92, 1999. • Backhaus, J., Hegseth, E., Wehde, H., Irigoien, X., Hatten, K., and Logemann, K. Convection and primary production in winter. Marine Ecology Progress Series, 251:1–14, 2003. • Janout, M. Biological parameterization of convection in a mixed layer model. Pages 1–87, 2003. • Lorkowski, I., Pätsch, J., Moll, A., and Kühn, W. Interannual variability of carbon fluxes in the North Sea from 1970 to 2006 - Competing effects of abiotic and biotic drivers on the gas-exchange of CO2. Estuarine, Coastal and Shelf Science, 2012. • Taylor, J. and Ferrari, R. Shutdown of turbulent convection as a new criterion for the onset of spring phytoplankton blooms. Limnology and Oceanography, 56(6):2293, 2011.