Download
1 / 17
190 likes | 879 Views
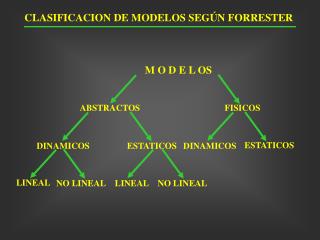
CORRELACIÓN Y REGRESIÓN LINEAL. PROFESORA: LILIANA ALDANA. CORRELACIÓN LINEAL. RELACION TIPO ESTADISTICO ENTRE DOS VARIABLES. EJEMPLOS Horas de estudio (x) Calificación obtenida (y) Libros leídos (x) Errores ortográficos (y) Medidas preventivas (x) Núm. Lesiones (y)

E N D
CORRELACIÓN Y REGRESIÓN LINEAL PROFESORA: LILIANA ALDANA
CORRELACIÓN LINEAL • RELACION TIPO ESTADISTICO ENTRE DOS VARIABLES. • EJEMPLOS Horas de estudio (x) Calificación obtenida (y) Libros leídos (x) Errores ortográficos (y) Medidas preventivas (x) Núm. Lesiones (y) Edad (x) Respuestas inadecuadas(y) Contaminación(x) Enfermedades(y)
Características La correlación se encuentra entre (-1, 1) La correlación puede ser positiva. La correlación puede ser negativa. La correlación puede ser nula.
CORRELACIÓN POSITIVA Significa que individuos que tienen puntuaciones ALTAS en una variable tienden a obtener puntuaciones ALTAS en la otra variable y viceversa.
CORRELACIÓN NEGATIVA Significa que individuos que tienen puntuaciones ALTAS en una variable tienden a obtener puntuaciones BAJAS en la otra variable y viceversa.
CORRELACIÓN NULA Significa que no existe dependencia entre las variables.
DIAGRAMA DE DISPERSIÓN Representación en un sistema de coordenadas rectangulares, donde (x, y) son los valores de las variables correlacionadas
Correlación positiva GANANC I AS VENTAS
CORRELACIÓN NEGATIVA EMBARAZOS y ANTICONCEPTIVOS (x)
CORRELACIÓN NULA Partidos ganados Calificaciones
COEFICIENTE DE CORRELACIÓNDE PEARSON • Sirve para medir la relación existente entre las variables correlacionadas.
Se agregan tres columnas más. Se sustituyen los valores en el coeficiente Pearson.