Download
1 / 5
50 likes | 135 Views
Each results report will contain: C hromatogram for sample All proteins identified with probability <1.0 List of peptides identified for each protein Amino acid coverage of each protein identified. Example of a chromatogram (peptide with 12.6 min retention time highlighted in red ).

E N D
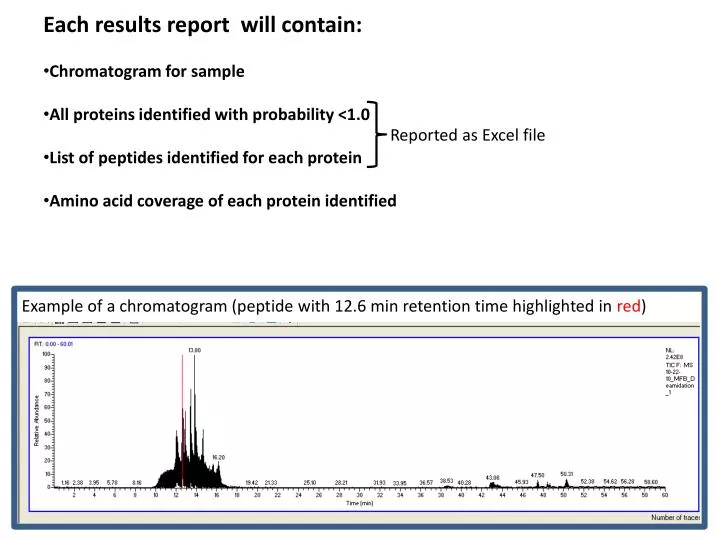
Each results report will contain: • Chromatogram for sample • All proteins identified with probability <1.0 • List of peptides identified for each protein • Amino acid coverage of each protein identified Example of a chromatogram (peptide with 12.6 min retention time highlighted in red) Reported as Excel file
Example of proteins identified in sample Probability – lower the number, the higher the probaility of a match Sf – final score indicates how good the protein match is Score – Value based on the probability that the peptide is a random match to the spectral data MW – Molecular weight of the protein Accession # - Unique protein identification number for the sequence Peptide (Hits) – Total number of peptide matches Example of amino acid sequence coverage (in red) of a protein identified in sample
Example of Excel file included in a report. Protein parameters are shaded in grey. Includes peptides (partial list shown) identified for that protein Protein Identification (P) Probability– lower the number, the higher the probaility of a match Sf – final score indicates how good the protein match is Score – Value based on the probability that the peptide is a random match to the spectral data MW– Molecular weight of the protein Accession # - Unique protein identification number for the sequence Peptide (Hits) – Total number of peptide matches Peptide Identification MH+ P(pep) Sf XC DeltaCn Sp RSp Ions Count
MS/MS fragment ion matches for peptide fragment K.NWETEITAQPDGGK.T with 12.6 min retention time. Specific fragment ion matches can be included in report at your request. The list of B and Y ions as they match against the experimental data (matched B ions – red, matched Y ions – blue) The mass errors of the measurement. MS/MS data of fragment ions that matched theoretical data of database