Download
1 / 49
490 likes | 497 Views
The Global Fuel Economy Initiative. Elisa Dumitrescu, UNEP Podgorica, Montenegro 20 November 2015. Why are we here? Auto fuel economy GFEI Global view, COP21 Focus on Montenegro (tools, policy options, INDC ’ s). Global Fuel Economy Initiative.

E N D
The Global Fuel Economy Initiative Elisa Dumitrescu, UNEP Podgorica, Montenegro 20 November 2015
Why are we here? • Auto fuel economy • GFEI • Global view, COP21 • Focus on Montenegro (tools, policy options, INDC’s)
Global Fuel Economy Initiative Six core partners: FIA Foundation, UNEP, IEA, ITF, ICCT and UC Davis, financial support from GEF and EU GFEI recognized as leading initiative in energy and climate reports and discussions
The Global Auto Fleet … is set to double, if not triple…. …. with 90% of this growth taking place in developing countries….. IEA 2011 IEA 2011
IEA WEO 2012: heading toward 2 billion cars OECD is fairly saturated, but rest of the world is not:
Transport over ~60% global oil demand, among fastest growing sectors of CO2 emissions from fuel combustion, passenger transport 60% and freight transport 40% of transport energy demand
BAU vs. Stabilization: fuel consumption, CO2 from cars to double 2000-2050 (IEA) World LDV CO2 emissions, business as usual vs GFEI, million tonnes (Mt) CO2, GFEI intervention (IEA 2009)
Fuel Economy Policy Globally Source: GFEI August 2014
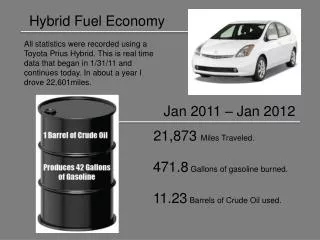
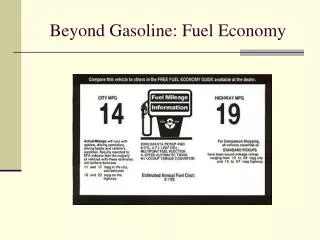
What is fuel economy? • Vehicles use energy, and fuel economy measures energy per unit of vehicle travel. It is the RATE of energy use. • Litres per 100km (Europe) • Km per litre (Japan) • Miles per gallon (United States) • Fuel economy, fuel efficiency, fuel intensity are all fairly interchangeable terms. But fuel economy always refers to fuel use relative to distance travelled.
Only 20% of the energy is converted into movement IEA 2012 • Most energy lost as heat Countries around the world currently have an average new car fuel economy that varies by over 50% e.g. United States about 9 L/100km, France below 6
What is fuel economy? (2) • Fuel economy improvement can be achieved through • Technical changes to vehicles • Changing the types of vehicles bought (size, technology) • Improving vehicle maintenance • Changing the way vehicles are driven (eco-driving) • Reducing traffic congestion • Fuel economy improvement to vehicles should be part of a broader strategy: • Traffic management • City and regional planning • Promotion of public transit • Etc.
EU Fuel Economy Regulations No 443/2009 & No 333/2014 • June 2007 Council of Environment Ministers adopts resolution to approve the shift to mandatory standards and an integrated approach to achieve 120 gCO2/km (5.2 l/100km or 45.6 mpg), with carmakers achieving 130 gCO2/km (5.6 l/100km or 42 mpg) through technical improvements and the remaining 10 g/km coming from complementary measures. • April 2009 European Parliament and the Council approved Regulation (EC) No 443/2009 setting a target of 130 gCO2/km (5.6 l/100km or 42 mpg) for the average emissions of new cars to be phased-in by 2015 • Regulation (EU) No 333/2014 95 gCO2/km (4.1 l/100km or 57.6 mpg) 2020
Not same thing as Euro 1/I – 6/VI • European Union emission regulations for new light duty vehicles (passenger cars and light commercial vehicles) were once specified in Directive 70/220/EEC with a number of amendments adopted through 2004. In 2007, this Directive has been repealed and replaced by Regulation 715/2007 (Euro 5/6).
Auto fuel economyimprovementplayslargestrole, particularlythrough 2030, in cutting energy-related CO2 emissions from transport by more than half in 2050 (compared with 2009). IEA 2012 2-degree scenario Source: Lewis Fulton, UC Davis & IEA Energy Technology Perspectives 2012
BAU vs. Stabilization: fuel consumption, CO2 from cars to double 2000-2050 (IEA) World LDV CO2 emissions, business as usual vs GFEI, million tonnes (Mt) CO2, GFEI intervention (IEA 2009) double auto fuel economy by 2050 + flanking measures
Fuel Economy Improvements are Cost-effective Fuel savings more than pays for fuel economy improvements in light-duty vehicles Source: IEA Fuel Economy Roadmap, July 2012
GFEI ’50by50’ or 8 Lge/100km to 4 Lge/100km
Next 2 decadeswillbe ICE-driven • Even in 2°C scenario, ICE-powered vehicles will dominate • Electrification strategy matters most after 2030 in OECD, 2050 worldwide, but must begin now Source: Lewis Fulton, UC Davis ITS, IEA ETP 2012
What is fuel economy? (3) • Note on diesel: there is about 2.4 kg of CO2 emitted per litre of gasoline burned, 2.6 for diesel. Diesel fuel 10% more carbon and more energy than gasoline. Greater energy content, greater efficiency. • If you improve vehicle fuel economy, you: • Save fuel • Reduce costs • Cut CO2 emissions • Don’t help air quality very much (though there are some links)
Fuel economy & Air Pollution Air pollutants affecting human health • NOx • Non-methane hydrocarbons • particulates • carbon monoxide • Toxic emissions (e.g. benzene) • Heavy metals Air pollutants affecting the climate • CO2 • Methane • Black carbon • N20 Fuel quality / tailpipe controls Fuel economy improvement
RESEARCH GLOBAL CAMPAIGNS IN-COUNTRY POLICY SUPPORT globalfueleconomy.org
Source: GFEI 2014 International Fuel Economy Comparison, WP11
IN-COUNTRY POLICY SUPPORT China India Australia Chile Peru Indonesia Philippines Thailand Vietnam Ethiopia Kenya Macedonia Montenegro Georgia
Fuel Economy Policy Globally Source: GFEI August 2014
Chile • First mandatorylabeling systemfor LDV’s in Latin America, March 2012 www.compraunautolimpio.cl • Feebate proposal based on a bonus/malus system, including CO2 and local pollutants became First Tax for emission and fuel consumption in Chilean vehicle market
Montenegro EU Japan Montenegro 2007-2012: 6.45 L/100km, 6.29 L/100km, 6.27 L/100km, 6.12L/100km, 5.95 L/100km, 6.03 L/100km; 6.5% improvement?? EU: 2005 6.89 L/100km, 2015 5.56 L/100km; 2020 4 L/100 km
Fuel Economy: http://www.unep.org/transport/gfei/autotool/
GLOBAL CAMPAIGNS • GFEI is now recognised as the leading global initiative on fuel economy globally, and is at the centre of discussions in the UN Climate process: • COP20 and COP21 • Accelerator Platform in SE4ALL and Climate • Summit G20 – Transport Task Group implementing partner
GFEI at COP21: ‘100 FOR 50 BY 50’
Montenegro INDC • Transport included in INDC submission, part of national 30% reduction CO2 by 2030 compared to 1990 • Reduce transport emissions by 1.7 Mt CO2-eq. in 2030 • Reduce fossil fuel subsidies and promote use of natural gas • Among 120 INDCs submitted as of October 6, 2015, 76% explicitly identify the transport sector as a mitigation source
Thank you Hvala Elisa Dumitrescu Focal Point, East Europe elisa.dumitrescu[at]unep.org www.unep.org/transport www.globalfueleconomy.org
Cleaner, More Efficient Vehicles Tool • Feebate Tool http://www.unep.org/transport/gfei/autotool/
Fiscal Instruments • Registration (one-time) fee • Feebate • Circulation tax (e.g. yearly) Or combination…
Additional examples from European Automobile Manufacturers Association • Croatia: • Registration tax is based on CO2emissions, price and the type of fuel used. The CO2component varies from 1.5% (up to 100 g/km) to 31% (above 300 g/km) for diesel cars and from 1% (up to 100 g/km) to 29% (above 300 g/km) for cars using petrol, CNG or LPG as well as diesel cars meeting Euro 6 standards. • Luxembourg: • Annual circulation tax for cars registered since 1 January 2001 is based on CO2 emissions. Tax rates are calculated by multiplying the CO2 emissions in g/km with 0.9 for diesel cars and 0.6 for cars using other fuels respectively and with an exponential factor (0.5 below 90 g/km and increased by 0.1 for each additional 10 g of CO2 /km). Source: http://www.acea.be/publications/article/overview-of-co2-based-motor-vehicle-taxes-in-the-eu
Additional examples from European Automobile Manufacturers Association, ctd. • Latvia: • Registration tax is based on CO2 emissions. Rates vary from € 0.43 per g/km for cars emitting 120 g/km or less to € 7.11 per g/km for cars emitting more than 350 g/km. • Malta: • Registration tax is calculated through a formula that takes into account CO2 emissions, the registration value and the length of the vehicle. The annual circulation tax is based on CO2 emissions and the age of the vehicle. During the first five years, the tax only depends on CO2 emissions and varies from € 100 for a car emitting up to 100 g/km to € 180 for a car emitting between 150 and 180 g/km.
Additional examples from European Automobile Manufacturers Association, ctd. • Slovenia: • Registration tax is based on price and CO2emissions. Rates vary from 0.5% (petrol) and 1 % (diesel) respectively for cars emitting up to 110 g/km to 28% (petrol) and 31% (diesel) respectively for cars emitting more than 250 g/km.
France: • Feebate bonus‐malus system, a premium is granted for the purchase of a new electric or hybrid electric vehicle (car or LCV) when its CO2 emissions are 110 g/km or less. The maximum premium is € 6,300 (20 g/km or less). An additional bonus of € 200 is granted when a vehicle of at least 15 years old is scrapped. A malus is payable for the purchase of a car when its CO2 emissions exceed 130 g/km. The maximum tax amounts to € 8,000 (above 250 g/km). Cars emitting more than 190gCO2/km pay a yearly tax of € 160.
Additional examples from European Automobile Manufacturers Association, ctd. • Finland: • The registration tax is based on CO2 emissions. Rates vary from 5 to 50%. The annual circulation tax is based on CO2 emissions for cars registered since 1 January 2001 (total mass up to 2,500 kg) or 1 January 2002 (total mass above 2,500 kg) respectively and for vans registered since 1 January 2008. • Germany: • The annual circulation tax for cars registered as from 1 July 2009 is based on CO2 emissions. It consists of a base tax and a CO2 tax. The base tax is € 2 per 100 cc (petrol) and € 9.50 per 100 cc (diesel) respectively. The CO 2 tax is linear at € 2 per g/km emitted above 95 g/km. Cars with CO2 emissions below 95 g/km are exempt from the CO 2 tax component.
Directive 1999/94/EC stipulates that a fuel economy label must be attached to the windscreen of all new passenger cars at the point of sale, must contain an estimate of fuel consumption, expressed in liters per 100 kilometers or in kilometers per liter (or in miles per gallon), and of CO2emissions. • The requirements of EU Directive 1999/94/EC on fuel efficiency labeling of passenger cars are implemented differently in the Member States UK new and used vehicle labels http://www.dft.gov.uk/vca/fcb/new-car-fuel-consump.asp
Reporting obligation for: Monitoring and reporting of average CO2 emissions (passenger cars) The Regulation (EC) No 443/2009 requires Member States to record information for each new passenger car registered in its territory. Every year, each Member State shall submit to the Commission all the information related to their new registrations. In particular, the following details are required for each new passenger car registered: manufacturer name, type approval number, type, variant, version, make and commercial name, specific emissions of CO2, mass of the vehicle, wheel base, track width, engine capacity, fuel type and fuel mode.
UNEP/ICCT Feebate simulation tool • Uses pre-set or country-specific data of newly-registered vehicles (this can include both new and used vehicles) and their characteristics (including price) and the currency exchange rate.
For guidance on feebate design and best practice • http://www.theicct.org/best-practices-feebate-program-design-and-implementation
Feebate tool • Number of vehicles • Vehicle size • Vehicle weight • Vehicle engine size • Vehicle engine power (kW) Vehicle fuel efficiency (LGE/km) or CO2 emission figures (gCO2eq/km) • Vehicle age/year of production • Annual kilometers per year (km/year) • Registration tax ($/litre) Ownership tax ($/vehicle) Fuel taxes ($/litre) • Average purchase price ($/vehicle) • Number of vehicles by segment: Segment A (Small car) Segment B (Small car) Small Truck Segment C Medium Truck Segment D Segment E Segment F Large Truck GFEI baseline data needs • Vehicle make and model • Model production year • Year of first registration, if different from model year • Fuel type • Engine size • Domestically produced or imported • New or second hand import • Rated Fuel Economy per model and test cycle basis. This can be done either by getting data from country of origin or manufacturer (see Resources section below for links), or by testing of a select sample of vehicles. For more information on vehicle emission test cycles, see the test cycle summary, here) • Number of sales by model http://www.unep.org/transport/gfei/autotool/nextsteps/developing_a_baseline.asp#p2
Elisa Dumitrescu Focal Point, East Europe elisa.dumitrescu[at]unep.org www.unep.org/transport www.globalfueleconomy.org