Download
1 / 27
330 likes | 814 Views
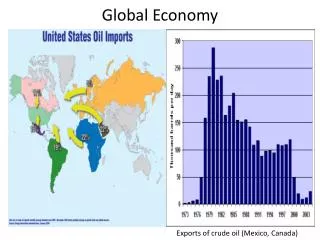
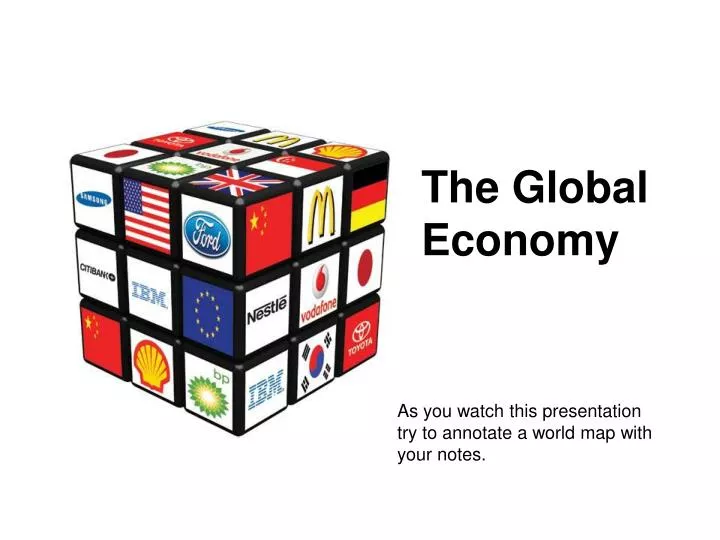
The Global Economy. As you watch this presentation try to annotate a world map with your notes. The Global Economy – Basic features Single World market – Producers produce to exchange rather than use. Price is determined on a global scale.

E N D
The Global Economy As you watch this presentation try to annotate a world map with your notes.
The Global Economy – Basic features • Single World market – Producers produce to exchange rather than use. Price is determined on a global scale. • 3 Geographical tiers – Core / Semi Periphery / Periphery • Temporal Patterns – Growth then stagnation. Hegemony (dominance of one country UK > USA > Japan > China?)
The Global Economy – Basic features • Integration or rejection – Reaction of societies, eg Islamic fundamentalism • Nation States – States function to protect their interests, their companies’ and peoples’ interests from the global economy • Alternative adaptions – How do nation states adapt to the global economy? Export led, protectionism, isolationism, CPE, Free market.
Car Exports 2002 Earnings from passenger car exports make up 5.3% of all earnings made from international exports. Japan and Germany together make 61% of all net profits (US$) on international car exports. Japanese car brands include Toyota, Nissan, Suzuki, Subaru, Honda, Mitsubishi and Mazda. German car brands include Audi, BMW, Mercedes, Volkswagen and Porsche.
Internet Users 2002 During the 12 years from 1990 to 2002, people using the Internet increased in number by 224 times. By 2002 there were 631 million Internet users worldwide. The distribution of Internet users worldwide has changed remarkably over just a dozen years. In 1990 Internet users were mainly found in the United States, Western Europe, Australia, Japan and Taiwan. By 2002 people living in Asia Pacific, Southern Asia, South America, China and Eastern Europe were notable Internet users. A not insignificant number of Internet users are also shown to be in Northern Africa, Southeastern Africa and the Middle East.
Finance and Insurance Exports 2002 Of all the net finance and insurance services exports in the world, 99% of the profit flows to territories in Western Europe. Despite this, almost half of the 24 territories in Western Europe have no net finance and insurance services exports. The main exporting territories for these services are the United Kingdom, Switzerland, Germany and Luxembourg. The Malvinas (or Falkland Islands) are large on this map because they are resized according to the United Kingdom data.
Global Economic Triangle of the CORE • North America • Western Europe • East Asia Main trade flows are between these three areas. Countries in this core have diversified economies, with high output, high purchasing power and large domestic markets. Outside this core, the global periphery is a location of cheap raw materials or cheap manufacturing or a market for the core to “dump” their surplus products.
Semi Periphery A wide range of countries. First waves of NICs – South Korea, Taiwan, Hong Kong, Singapore Second wave of NICs or RICs – eg Malaysia, Mexico, South Africa BRICs – Brazil, Russia, India, China. Resource exporting countries, Recently and Newly Industrialised Countries, Former Socialist Countries, Poorer European Countries. Some of these countries could now be seen as part of the CORE (South Korea) others are characterised by regional disparities and social polarisation (Brazil) others with very rapid economic growth (Slovakia, China)
The Periphery • LEDCs. Mainly Africa. • Small domestic markets, lack of infrastructure, population increase, low economic output, low levels of economic diversification, high agricultural population.
“A theory must be tempered with reality.” Jawaharlal Nehru Indian politician (1889 - 1964) In other words all the following theories are not “truths”. There is empirical evidence to prove and disprove all these theories. We are dealing with the real world not a controlled lab experiment!
Resource Endowment and Environmental Determinism Resource endowment suggest that development is dependent on the resources (both natural and human) the country has to exploit. There are links with the theory of environmental determinism which suggests that human activity is determined by the environment. European development due to its coal and iron reserves, fertile soils, temperate climate and low frequency and intensity of natural hazards. Taiwan, Japan, Brazil, Nigeria?
Rostow’s Stages of Economic Growth Model This is a linear model. It suggests that all countries go through the same stages. There are disparities because we are no longer all subsistence farmers. Just like the demographic transition model it is based on the experiences of Western Europe and North America. It does not take into account spatial differences within a country. The big question is why do countries fail to “take off”? Nagle – page 442
Cycle of Poverty Countries can be seen as trapped in a Cycle of Poverty. A self perpetuating combination of factors which unless broken will stop development.
Clarke’s Sector Model (Colin Clarke 1905 – 1989) Another linear model. This time suggesting that all economies start off as agricultural and then go through a period of industrialisation and then develop into post industrial economies. Success in one sector sets the conditions to move to the next stage. Why do some countries fail to industrialise?
The New International Division of Labour The spatial decentralisation of many economic activities. Until recently the NIDL was seen as the spatial decentralisation of manufacturing away from the Core to Semi Peripheral areas. Now we can observe a NIDL in services and an increasing decentralisation of coordination and control operations.
World Systems Analysis There is a Global Economy which all countries are a part of. Therefore countries are interdependent and development in one country depends on the country’s position in the Global Economy (World system) -According to the model, the capitalist world system has three main characteristics -A global market, many countries allowing political and economic competition and… -The Global Economy is divided into the Core, Semi Periphery and Periphery. World Systems Analysis theorists such as Immanuel Wallerstein argue that the development of the Core is a result of its exploitation of the Periphery.
Cumulative Causation Can be used on a global scale or within countries to explain regional disparities. Cumulative Causation – Spiral of advantages that occur in a specific geographical location (core). Core – Initially based on comparative advantages (resource endowment and location), develops from acquired advantages (multiplier effect, agglomeration, increased tax revenue, increased public spending, education and health care, skilled labour, improvements in infrastructure). Periphery – Inaccessible, underpopulated, resource poor. Gunnar Myrdal (1957) - Rich lands and Poor lands
Backwash Effects Negative effects of the core’s growth on the periphery. Out-migration of economically active people, outflows of capital, decreasing tax base, firms of the periphery not able to compete with the firms of the core and therefore periphery being flooded with core’s products. Spread Effects Positive effects of the core’s growth on the periphery. Core unable to supply all the products the Core is demanding so supply from the Periphery to the Core. Core becomes affected by NEGATIVE EXTERNALITIES (high rents, overcrowding, congestion) so firms locate in periphery. Key question – Will the benefits of the Core’s development “spread” or “trickle down” to the periphery?
John Friedmann’s Model of Regional Development Upward transitional area could be seen as the semi periphery. Resource frontier is peripheral but endowed with resources. Downward transitional area could be seen as the periphery suffering from backwash effects of development in the Core.
John Friedmann’s Stages of Growth Gives a more detailed explanation of periphery and highlights that spatial inequalities change over time. Stage 1 – No urban hierarchy Stage 2 – Primate city Stage 3 – Regional sub-centres Stage 4 – Regional inequalities are reduced in a fully integrated urban system
John Friedmann’s Stages of Growth STAGE 1: When towns/regions are developing independently with very minimal contact between them - possibly some basic trading of goods.STAGE 2: One town or region becomes dominant, probably because it has more physical or human resources. The core starts attracting people and investment from other regions.STAGE 3: New smaller cores (semi-periphery) start to develop and there is an increase in flows between the core and the semi-periphery (two ways flows e.g. FDI)STAGE 4: All areas are now developed and fully dependent upon each other with flows of capital and people in both directions.
Dependency theory Domination of the rich over the poor has led to continued and growing disparities between the rich and the poor. European colonialism of the rest of the world started in fifteenth century and continued to the 1970’s. 500 years of exploitation of the human and natural resources of Africa, Asia and the America’s. Dependency on foreign capital, loans and aid has led to many LEDCs facing a huge debt burden and a loss of control of their state finances to institutions such as the World Bank and IMF often resulting in forced reductions to public spending on health care and education. The global economy benefits the rich at the expense of the poor. Poorer countries are encouraged (forced through World Bank and IMF rules) to open up their economies to foreign competition. This leads to “neo-colonialism” by TNCs. At the same time richer countries maintain high levels of protectionism. European CAP
Why are there disparities in the level of development of different countries? Countries have different levels of resources and there is a positive correlation between resources and development. (Resource Endowment) All countries are making the same linear progression but are at different stages of development. (Rostow’s and Clarke’s models) Countries are either in the Core, Semi Periphery or Periphery of a larger system which is the Global Economy. This system is dynamic but would be expected to follow a pattern of growth in the core followed by a spread of growth from the core to the semi periphery and periphery (Cumulative causation within a World System) There are disparities because the rich exploit the poor and the poor are dependent on and dominated by the rich (Dependency Theory)