Download
1 / 62
620 likes | 740 Views
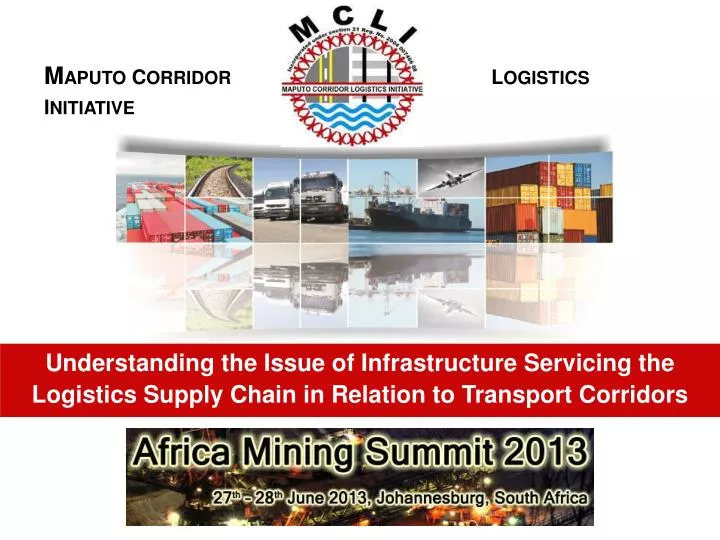
M APUTO C ORRIDOR L OGISTICS I NITIATIVE. Understanding the Issue of Infrastructure Servicing the Logistics Supply Chain in Relation to Transport Corridors. The Continent’s Trade Picture The Tripartite Free Trade Area

E N D
MAPUTO CORRIDOR LOGISTICS INITIATIVE Understanding the Issue of Infrastructure Servicing the Logistics Supply Chain in Relation to Transport Corridors
The Continent’s Trade Picture • The Tripartite Free Trade Area • Infrastructure on the Maputo Corridor THIS PRESENTATION
MCLI is based very much within the transport policies of SADC, AU and NEPAD and these are the policies that the UN Economic Commission is promoting for Africa to increase African trade at a faster pace and for regional integration to take place. THE AFRICAN GLOBAL TRADE PICTURE
Africa’s share of world trade is not significant • WORLD TRADE IN EXPORTS – 2000-2010 • Account for approx. 3.6 % of world exports with annual value of $418 billion, growing 14.4% p.a. • WORLD TRADE IN IMPORTS – 2000-2010 • Account for approx. 1.8 % of world imports with annual value of $174bn, growing 7.9 % p.a. THE AFRICAN GLOBAL TRADE PICTURE
INTRA AFRICAN EXPORTS - 2000 to 2010 • Are 10.4% of total African exports • Average of $30bn with annual growth rate of 14.6 % • INTRA AFRICAN IMPORTS • Are 14.2 % of total African imports • $29bn with annual growth of 14.4 % INTRA AFRICAN TRADE
Logistics costs in Africa are the highest in the world • Building infrastructure to link countries and removing trade barriers between countries will reduce costs • Soft infrastructure is often lacking - a significant barrier to trade • Institutional and legal frameworks need to be in place to allow the development of regional projects • WEF Press Release THE AFRICAN GLOBAL TRADE PICTURE
The governments of the WORLD can no longer provide the necessary infrastructure unaided. There HAVE to be Public Private Partnerships. Source: OECD • World Bank determined African backlogs are 50% energy; 25% transport; 15% ICT; 10% water and sanitation. • Success in developing projects in Africa lies in best harnessing the benefits of both public and private sectors in developing its resources • Peter Copley PrEng THE AFRICAN GLOBAL TRADE PICTURE
Costs of transport in Southern Africa • Some are surprised to learn that transport costs in South Africa are approximately equal to the World’s average transport costs • But once crossing borders come into the question, costs go up by a factor of between 4 and 8 (Source: Dr Gael Raballand’s doctoral thesis under the auspices of the World Bank) • Why? Because we don’t think as a region. • Peter Copley PrEng THE AFRICAN GLOBAL TRADE PICTURE
The Tripartite Free Trade Area • Will be an integrated market of 26 member states • Will have a combined population of nearly 600 million people • Will have a total GDP of approximately US$1.0 trillion (more than half of the output of Africa’s economies) THE TRIPARTITE FREE TRADE AREA
The Primary Goal? To reduce and eventually eliminate tariffs imposed on goods originating and traded in the region. TRIPARTITE FREE TRADE AREA BY 2014
January to December 2012 - total trade between SA and Mozambique totalled R29,7 billion • Main import commodities – fuel, fruit, steel tubes and pipes • Main export commodities – coal, ferrochrome, magnetite, sugar, steel, maize THE TRADE FIGURES
WHY IS REGIONAL INTEGRATION IMPORTANT? • Contributes to political stability • Encourages good regional governance initiatives • Reduces the risk of conflict • BUT! It requires strong commitment to the implementation of agreements • TW Oshikoya 2010 THE REGIONAL INTEGRATION IMPERATIVE
How are transport corridors important for the mining sector on the corridor • Transport Corridors provide industry with global access to markets. • The MAPUTO CORRIDOR is a true transportation corridor linking South Africa, Swaziland and southern Mozambique by 3 key elements: • Road • Rail • Ports & Terminals • The Maputo Corridor opens up South African industries to access export markets to Africa and the Far East IMPORTANCE OF TRANSPORT CORRIDORS FOR THE MINES
What are the new developments for the mining sector on the corridor? • SwaziLink Coal Line • Upgrading of the Port of Maputo • Upgrading of the Matola Coal Terminal • Feasibility studies being considered by TFR to enhance Maputo Link Corridor Operation • N4/EN4 route upgrades to assist with the increase of heavy freight vehicles on the corridor DEVELOPMENTS IN THE MINING SECTOR
Road – 581kms Rail – 590kms Re-established proven transportation route for regional trade and to international markets for SA, Zimbabwe, Swaziland, Botswana through Mozambique. THE MAPUTO CORRIDOR
Maputo is a key node in providing access to regional commodities • Key markets are India and China • Port Maputo Compliments South African Ports in accommodating regional demand in a multi-purpose port THE STRATEGIC LOCATION OF PORT MAPUTO
ROAD INFRASTRUCTURE: • N4/EN4 Toll Road Concession - Build-Operate-Transfer agreement • TRAC is the first cross-border PPP in Africa • R4billion invested since 2000 with the constructing and maintenance of the roads • A further R1.5billion will be invested in the next few years INFRASTRUCTURE ON THE MAPUTO CORRIDOR
ROAD INFRASTRUCTURE: • Heavy vehicle traffic is growing at an average of between 7-10% per annum • Traffic between Matola and Maputo has increased way ahead of original projection – on a peak day Maputo Plaza averages 50-55 thousand vehicles per day INFRASTRUCTURE ON THE MAPUTO CORRIDOR
RAIL INFRASTRUCTURE: • $200M invested by CFM in rehabilitation of the lines, bridges, rolling stock and locomotives since 2008. • We currently have 48 trains per week on the RG Line • Current Rail Traffic on RG Line is 4.5MTPA • Projected Rail Traffic on RG Line is >50MTPA • The lack of rail capacity is still one of the constraining factors on our corridor INFRASTRUCTURE ON THE MAPUTO CORRIDOR
RAIL INFRASTRUCTURE: • R17billion to be invested by TFR and SwaziRail for the 146km “SwaziLink” railway line to Maputo. • This line will create an additional 15MTPA to the Waterberg and Eskom Road to Rail Migration Programme INFRASTRUCTURE ON THE MAPUTO CORRIDOR
BORDER POST: • Heads of State agreement on the 24 hour one stop border post in 2007 • Still not implemented despite the massive trajectory of growth • A NEW 24 HOUR ONE STOP BORDER POST IS ESSENTIAL ON THIS CORRIDOR INFRASTRUCTURE ON THE MAPUTO CORRIDOR
12 hour operation • Severe Congestion • Substantial delays • Inefficiencies • Added logistics costs
BORDER POST: • Freight bypass road opened 11 June 2010 • Pedestrian facility opened March 2013 • With the new infrastructure that has been pumped into the border post we no longer have cargo, passengers and pedestrians moving through the same little border post INFRASTRUCTURE ON THE MAPUTO CORRIDOR
FREIGHT BYPASS ROAD OPENED JUNE 2010 CLEARING KM4 PEDESTRIAN FACILITY OPENED FULLY OPERATIONAL Cars, tourist, passengers 18 hour operation 24 hours at peak periods Ressano Garcia Freight, cargo Pedestrians Pedestrians Freight, cargo Lebombo Cars, tourist, passengers
BORDER POST: • Between 400 and 600 bulk trucks per day through LRG • Clearing time between 4 and 8 mins due to improved EDI and SeW efficiencies • Some C&F agents have it down to between 2 and 3 mins • With the new systems at the border post we have been experiencing a bit of delays and congestion from time to time, but this problem leans more toward a new system and people having to get used to the new system and new forms. INFRASTRUCTURE ON THE MAPUTO CORRIDOR
BORDER POST: • Compliance an extremely important issue when it comes to electronic systems and I think our cargo owners and movers are still trying to get into that flow. • Time and motion study by one MCLI member 5½ hours from RG to port, offload and back to RG INFRASTRUCTURE ON THE MAPUTO CORRIDOR
Lebombo/Ressano Garcia Border Post • 1998– 29 000 tons through border post - • 2007 – 2.25million tons • In the 2 years between 2005 and 2007 • 43% increase in passengers • 73% increase in cars and busses • 65% increase in the total number of vehicles that crossed the border • 1,1 million passengers in Dec 2007 alone • Design capacity maximum 8000 per day
$300 million invested in Port Maputo since 2002 • Port Master plan envisages a further capital investment in the port of USD $1,2 billion in the next 20 years • Concession extended to 2033 with an option to extend for a further 10 years to 2043 • Increased throughput from current 17 Million tons to 48 million tons • Ongoing Channel dredging programme to accommodate Panamax and post Panamax vessels THE PORT MASTER PLAN