Download
1 / 3
30 likes | 111 Views
Statistical modelling of suspended sediment off Stonehaven C. McCaig , A. Sabatino , M.R. Heath – Dept. Mathematics & Statistics, University of Strathclyde. chris.mccaig@strath.ac.uk. Introduction

E N D
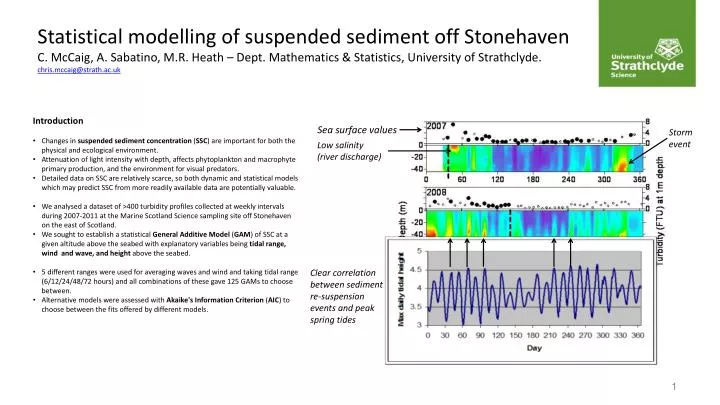
Statistical modelling of suspended sediment off Stonehaven C. McCaig, A. Sabatino, M.R. Heath – Dept. Mathematics & Statistics, University of Strathclyde. chris.mccaig@strath.ac.uk • Introduction • Changes in suspended sediment concentration (SSC) are important for both the physical and ecological environment. • Attenuation of light intensity with depth, affects phytoplankton and macrophyte primary production, and the environment for visual predators. • Detailed data on SSC are relatively scarce, so both dynamic and statistical models which may predict SSC from more readily available data are potentially valuable. • We analysed a dataset of >400 turbidity profiles collected at weekly intervals during 2007-2011 at the Marine Scotland Science sampling site off Stonehaven on the east of Scotland. • We sought to establish a statistical General Additive Model (GAM) of SSC at a given altitude above the seabed with explanatory variables being tidal range, wind and wave, and height above the seabed. • 5 different ranges were used for averaging waves and wind and taking tidal range (6/12/24/48/72 hours) and all combinations of these gave 125 GAMs to choose between. • Alternative models were assessed with Akaike's Information Criterion (AIC) to choose between the fits offered by different models. Sea surface values Storm event Low salinity (river discharge) Clear correlation between sediment re-suspension events and peak spring tides
Statistical modelling of suspended sediment off Stonehaven C. McCaig, A. Sabatino, M.R. Heath – Dept. Mathematics & Statistics, University of Strathclyde chris.mccaig@strath.ac.uk Turbidity vs. time • Results • GAMs were tuned to the data for turbidity at the main sampling site (56.96225N 2.11219W). • The AIC scores for these models were all very similar with the best fit offered by the model with 3 day averaged waves, 3 day averaged winds and 6 hour tidal range. • Results presented here are for this model. • The GAM explained 92.2% of the variability in the data. • In Fig 1. we compare the results predicted in our GAM with the measured turbidity at the study site, for the full data set as well as in 10m bands above the sea bed. Predicted vs. observed turbidity Fig. 3 Fig. 4 • We next applied our tuned model to an alternative site closer to shore (56.9612N 2.13837W). • The results for this are presented in Fig 2. • We see in Fig 1., and most notably in Fig 2., that the GAM does less well at predicting the turbidity closest to the seabed, with the best fits being seen nearer the surface, where turbidity is lower. • In Figs 3. and 4. we plot turbidity against date (with multiple data for every date sampled) and see that the fit between the predicted and observed turbidity is best in summer and poorest in winter. • One factor that may explain this is changes in river discharge at different times of year. • Future work will expand the GAM to make use of data for this with the hope of better describing turbidity at sites other than the one where the GAM was tuned. Fig. 1 Fig. 2
Statistical modelling of suspended sediment off Stonehaven C. McCaig, A. Sabatino, M.R. Heath – Dept. Mathematics & Statistics, University of Strathclyde chris.mccaig@strath.ac.uk • Conclusions • We see in Figs. 1 and 3 that the chosen GAM predicts well the turbidity at the site at which it was tuned. • When applied to data from another site the model, as we would expect, it performs less well, with the biggest differences between observed and predicted data being seen close to the seabed. • However, in Figs. 2 and 4 we can still see that the model predicts the turbidity better close to the surface. • Future Work • Future work will introduce a new explanatory variable, river discharge, to investigate what effect this may have on the predictive ability of the model. • In addition we have a smaller number of data available from other sites in the vicinity of Stonehaven, as well as surface tows from study sites back to shore. • We will investigate the effect of adding some of these to the data used to tune the model on the quality of the fit at other sites. Acknowledgements This work is part of the TeraWatt project, funded by the Engineering and Physical Sciences Research Council. terawatt.weebly.com