Download
1 / 66
670 likes | 821 Views
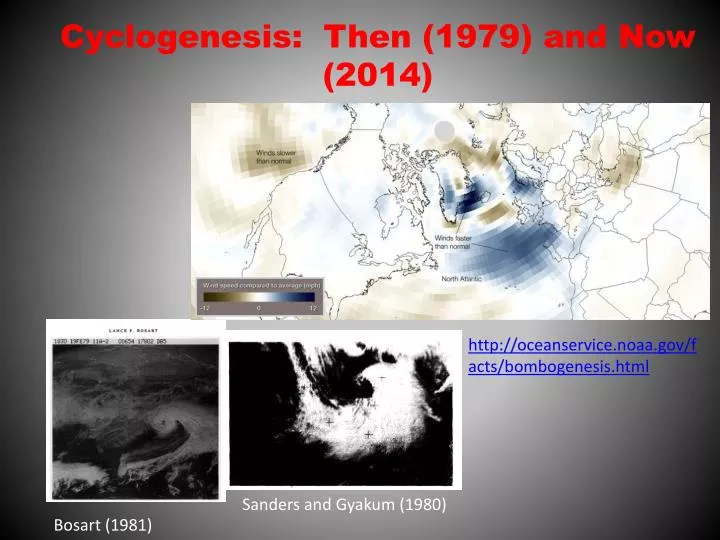
Cyclogenesis : Then (1979) and Now (2014). http://oceanservice.noaa.gov/facts/bombogenesis.html. Sanders and Gyakum (1980). Bosart (1981). Authors John R. Gyakum 1 Bryn Ronalds 1 Lance F. Bosart 2 Shawn M. Milrad 3 Eyad H. Atallah 1 Melissa Gervais 1

E N D
Cyclogenesis: Then (1979) and Now (2014) http://oceanservice.noaa.gov/facts/bombogenesis.html Sanders and Gyakum (1980) Bosart (1981)
Authors John R. Gyakum1 Bryn Ronalds1 Lance F. Bosart2 Shawn M. Milrad3 Eyad H. Atallah1 Melissa Gervais1 1Department of Atmospheric and Oceanic Sciences, McGill University, Montreal, QC 2Department of Atmospheric and Environmental Sciences, University at Albany, NY 3Applied Aviation Sciences Department, Embry-Riddle Aeronautical University, Daytona Beach, FL
Pressure, potential temperature, and equivalent potential temperature time series at weather ship ‘D’ for 28-30 January 1972 (Stubbs 1975) First cyclone’s maximum deepening of 2.6 bergerons!
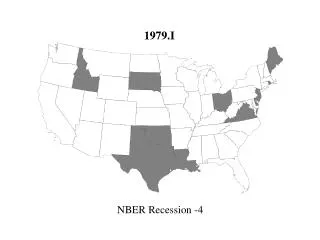
Motivation: The January 1972 surface cyclogenesis processes were associated with a regime change in the North Atlantic Basin Sanders and Gyakum (1980) noted the clustering of explosive cyclogeneses during 11-17 February 1979 At the end of this clustering was the Presidents’ Day cyclone
Six-hourly SLP, 1000-500 hPa thickness, Dynamic Tropopause (2 PVU level) jet (>100 knots) for 28 Jan-3 Feb 1972 Dark Blue: 474-480 dam Blue: 492-498 dam Pink: 540-546 dam Red: 558-564 dam
Previous slides illustrate the upscale growth of surface cyclonic coverage throughout the North Atlantic basin
The initial cyclogenesis (1200 UTC, 28 Jan) occurs on the equatorward side of the jet, where the moist Brunt-Väisälä frequency (Nm)2= (g/T)(T/z + m) is near zero (units of 10-4 s-2)
At 1200 UTC, 30 January 1972, the cyclone has migrated to the left exit region of the jet, while a new surface cyclogenesis is occurring on the equatorward side of the jet in near zero effective stability:
Consider that the more extreme of the N. Atlantic cyclones deepened at 2.6 bergerons). From Roebber (1984):
An index for North Atlantic Basin Storm Activity: Its relationship to explosive cyclogenesis • Theory • Observations • Surface cyclogenesis • Concluding discussion
Eady growth rate maximum: σ = 0.31 f| v/z |N-1, where N is the dry Brunt-Väisälä frequency N2 = (g/T)(T/z + d) and the moist baroclinic growth rate: σm = 0.31 f| v/z |Nm-1, where Nm is the moist Brunt-Väisälä frequency (Nm)2= (g/T)(T/z + m)
The North Atlantic Storm Index (NASTI): The count of events during which the areal coverage (%) in the North Atlantic basin (25-60 deg N; 80-0 deg W) of moist baroclinic growth exceeding 1.5/day exceeds 2 standard deviations from a 30-year running mean climatology
North Atlantic Storm Index from 1950 through February 2014 (counts of normalized standard deviations with absolute values exceeding 2.0)
Counts of NASTI events (DJF) from Dec. 1950 through February 2014 JFM 1992: JFM 2014:
Deep low (<960 hPa) maximum deepeningsvs forecasted (Bergerons)(of the 37 960 hPa cases during Dec. 2013-March 2014, 31 qualified as ‘bombs’) Forecasted Observed