Download
1 / 25
260 likes | 441 Views
The Five-Number Summary. Lecture 16 Sec. 5.3.1 – 5.3.3 Tue, Feb 12, 2008. The Five-Number Summary. A five-number summary of a sample or population consists of five numbers that divide the sample or population into four equal parts. These numbers are called the quartiles .

E N D
The Five-Number Summary Lecture 16 Sec. 5.3.1 – 5.3.3 Tue, Feb 12, 2008
The Five-Number Summary • A five-number summary of a sample or population consists of five numbers that divide the sample or population into four equal parts. • These numbers are called the quartiles. • 0th Quartile = minimum. • 1st Quartile = Q1. • 2nd Quartile = median. • 3rd Quartile = Q3. • 4th Quartile = maximum.
10 1 2 3 4 5 6 7 8 9 0 Example • If the distribution were uniform from 0 to 10, what would be the five-number summary?
10 1 2 3 4 5 6 7 8 9 0 Example • If the distribution were uniform from 0 to 10, what would be the five-number summary? 50% 50% Median
10 1 2 3 4 5 6 7 8 9 0 Example • If the distribution were uniform from 0 to 10, what would be the five-number summary? 25% 25% 25% 25% Q1 Median Q3
Example • Where would the median and quartiles be in this symmetric non-uniform distribution? 1 2 3 4 5 6 7
Example • Where would the median and quartiles be in this symmetric non-uniform distribution? 1 2 3 4 5 6 7
Example • Where would the median and quartiles be in this symmetric non-uniform distribution? 1 2 3 4 5 6 7 Median
Example • Where would the median and quartiles be in this symmetric non-uniform distribution? 1 2 3 4 5 6 7 Q1 Median Q3
Percentiles – Textbook’s Method • The pth percentile – A value that separates the lower p% of a sample or population from the upper (100 – p)%. • p% or more of the values fall at or below the pth percentile, and • (100 – p)% or more of the values fall at or above the pth percentile.
Finding Quartiles of Data • To find the quartiles, first find the median (2nd quartile). • Then the 1st quartile is the “median” of all the numbers that are listed before the 2nd quartile. • The 3rd quartile is the “median” of all the numbers that are listed after the 2nd quartile.
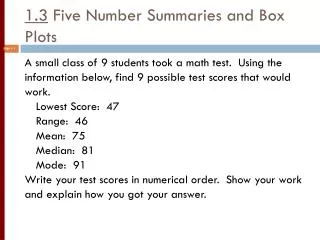
Example • Find the quartiles of the sample 5, 8, 10, 15, 17, 19, 20, 24, 25, 30, 32
Example • Find the quartiles of the sample 5, 8, 10, 15, 17, 19, 20, 24, 25, 30, 32 Median
Example • Find the quartiles of the sample 5, 8, 10, 15, 17, 19, 20, 24, 25, 30, 32 Find “median” Find “median” Median
Example • Find the quartiles of the sample 5, 8, 10, 15, 17, 19, 20, 24, 25, 30, 32 Median Q1 Q3
Example • Find the quartiles of the sample 5, 8, 10, 15, 17, 19, 20, 24, 25, 30, 32 Min Q1 Median Q3 Max
Example • Find the quartiles of the sample 5, 8, 10, 15, 17, 19, 20, 24, 25, 30, 32, 33
Example • Find the quartiles of the sample 5, 8, 10, 15, 17, 19, 20, 24, 25, 30, 32, 33 Median 19.5
Example • Find the quartiles of the sample 5, 8, 10, 15, 17, 19, 20, 24, 25, 30, 32, 33 Q1 12.5 Median 19.5 Q3 27.5
Example • Find the quartiles of the sample 5, 8, 10, 15, 17, 19, 20, 24, 25, 30, 32, 33 Min Q1 12.5 Median 19.5 Q3 27.5 Max
The Interquartile Range • The interquartile range (IQR) is the difference between Q3 and Q1. • The IQR is a commonly used measure of spread, or variability. • Like the median, it is not affected by extreme outliers.
IQR • The IQR of 22, 28, 31, 40, 42, 56, 78, 88, 97 is IQR = Q3 – Q1 = 78 – 31 = 47.
IQR • Find the IQR for the sample • 5, 20, 30, 45, 60, 80, 100, 140, 175, 200, 240. • Are the data skewed?