Download
1 / 10
100 likes | 344 Views
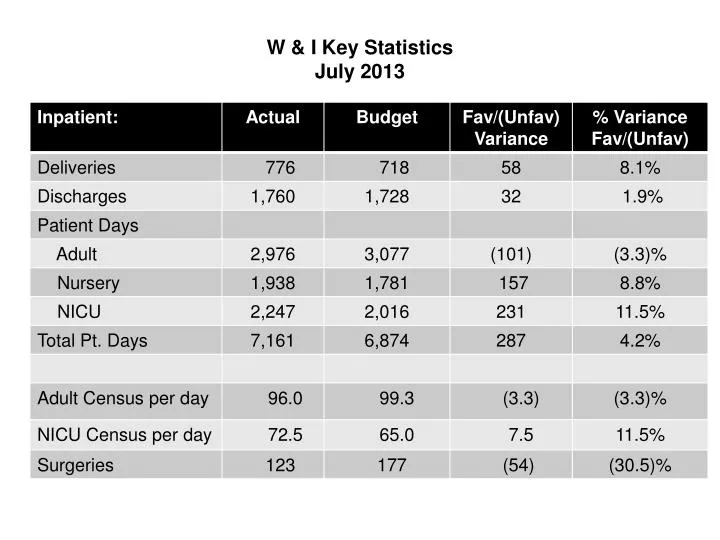
W & I Key Statistics July 2013. W & I Key Statistics July 2013. W & I Key Statistics Fiscal Year-to-date July 2013. W & I Key Statistics Fiscal Year-to-date July 2013. Women & Infants Corporation Controllable Expenses For the Month of July 2013.

E N D
Women & Infants CorporationControllable ExpensesFor the Month of July 2013 Variance ActualBudgetFav/(Unfav) Salaries $16,484,968 $16,471,582 (13,385) Medical Supplies 2,020,031 1,750,853 (269,178) Drugs 1,185,305 1,155,915 (29,390) Other Expenses: Consulting 134,516 165,422 30,906 Non-Medical Supplies 102,092 104,427 2,335 Purchased Services 1,521,578 1,652,735 131,157 Maintenance Contracts 60,787 111,717 50,930 Repairs & Maintenance 191,729 205,268 13,539 Food Costs 81,089 88,494 7,405 Rent Equipment 86,615 71,844 (14,771) Dues & Subscriptions 50,759 142,799 92,040 Travel & Education 50,502 81,214 30,712
Fiscal Year 2013 MetricsMonth of July 2013 CNE (excludes VNA)Women & Infants July July Variance July July Variance ActualBudgetFav/(Unfav) ActualBudgetFav/(Unfav) Cost Per Adjusted Day $2,361 $2,378 0.73% $ 2,670 $ 2,841 6.02% Cost Per Adjusted D/C $11,593 $11,724 1.12% $ 10,869 $11,301 3.82% FTE’s Per Adj Occp Bed 4.96 5.12 3.14% 5.83 5.88 0.77% Salary Per FTE $ 78,241 $ 80,556 2.87% $80,903 $ 85,557 5.44% Total Cost Per FTE $ 102,420 $104,742 2.22% $ 106,116 $112,458 5.64% OT as a % of Paid dollars 7.5% / 6.0% 3.7% / 2.4% Last Month 5.8% / 4.5% 2.8% / 2.4%
Women & Infants CorporationControllable ExpensesFiscal Year-to-Date as of July 2013 Variance ActualBudgetFav/(Unfav) Salaries $ 160,590,512 $ 163,934,010 $ 3,343,498 Medical Supplies 18,107,149 16,983,197 (1,123,952) Drugs 12,254,575 11,530,278 (724,297) Other Expenses: Consulting 1,247,196 1,654,220 407,024 Non-Medical Supplies 1,010,513 984,375 (26,138) Purchased Services 15,868,525 16,561,943 693,418 Maintenance Contracts 1,312,728 1,316,728 4,000 Repairs & Maintenance 1,358,443 1,342,662 (15,781) Food Costs 833,041 876,736 43,695 Rent Equipment 815,342 749,670 (65,672) Dues & Subscriptions 743,617 1,201,231 457,614 Travel & Education 783,970 1,092,387 308,417
Fiscal Year 2013 MetricsFiscal Year-to-Date July 2013 CNE (excludes VNA) Women & Infants July July Variance July July Variance ActualBudgetFav/(Unfav) ActualBudget Fav/(Unfav Cost Per Adjusted Day $2,359 $ 2,393 1.41% $ 2,819 $ 2,928 3.71% Cost Per Adjusted D/C $ 11,835 $ 11,873 0.32% $11,239 $11,633 3.39% FTE’s Per Adj Occp Bed 4.85 4.98 2.56% 5.51 5.71 3.47% Salary Per FTE $ 80,532 $ 81,081 0.68% $87,456 $ 89,148 1.90% Total Cost Per FTE $ 104,694 $ 105,807 1.05% $ 114,885 $ 117,333 2.09% OT as a % of Paid dollars 5.7% / 4.5% 4.6% / 3.3% Last month YTD 5.5% / 4.3% 5.3% / 3.9%
Care New England Health SystemStatement of OperationsFiscal Year-To-Date July 2013 Variance Actual Budget Fav/(Unfav) YTDYTDYTD Patient Service Revenue $ 752,146,289 $ 745,864,296 $ 6,281,993 Charity Care (32,736,365) (29,776,817) (2,959,548) Bad Debt (40,856,741) (36,771,180) (4,085,561) Other Revenues 48,775,150 47,782,999 992,151 Total Revenue $ 727,328,333 $ 727,099,298 $ 229,035 Salaries & Wages 355,634,333 359,264,866 3,630,533 Fringe Benefits 105,545,239 109,120,896 3,575,657 Medical Supplies & Drugs 66,808,033 63,960,691 (2,847,342) Other Expenses 113,064,836 109,600,145 (3,464,691) Insurance 22,182,879 22,249,472 66,593 Depreciation 23,680,736 24,647,933 967,197 Licensure Fee 26,921,425 26,921,425 -0- Interest 2,957,105 3,180,257 223,152 Total Operating Expenses 716,794,586 718,945,685 2,151,099 Net Operating Income $ 10,533,747 $ 8,153,613 $ 2,380,134 Operating Margin % 1.5% 1.1%