Download
1 / 37
370 likes | 465 Views
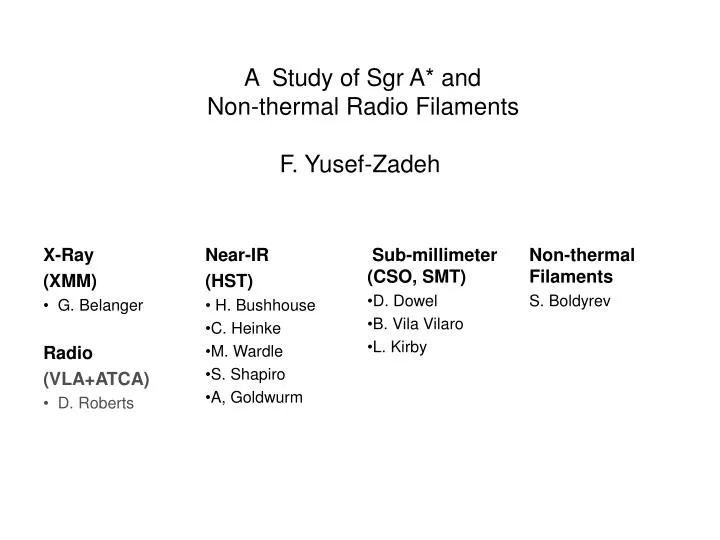
A Study of Sgr A* and Non-thermal Radio Filaments F. Yusef-Zadeh. Outline. Sub-mm. NIR. X-ray. Sgr A* Light curves in NIR wavelengths Sub-mm emission is variable Cross correlation Power spectrum of NIR emission Non-thermal Filamen ts Recent observations

E N D
A Study of Sgr A* and Non-thermal Radio Filaments F. Yusef-Zadeh
Outline Sub-mm NIR X-ray • Sgr A* • Light curves in NIR wavelengths • Sub-mm emission is variable • Cross correlation • Power spectrum of NIR emission • Non-thermal Filamen ts • Recent observations • Global vs local origin • Strong vs weak magnetic field • a new turbulent model
Two Epochs of Observations of SgrA* in 2004 March Campaign SMT Sub-mm CSO BIMA mm NMA VLA Radio ATCA XMM X/g-ray INTEGRAL September Campaign Sub-mm CSO VLA Radio NIR HST XMM X/g-ray INTEGRAL
Near-IR Line and Continuum (NICMOS /HST) • Observations: • 32 orbits of Camera 1 NICMOS in three bands: • F160:W Broad band at 1.6mm (1.4-1.8mum) • F187:N Narrow band at 1.87mm(1.865-1.885) (Pa line) • F190N: Narrow band at 1.9mm (continuum) • Each cycle: Alternating between the three bands for about 7-8 min • Six observing time intervals
1.6 mm image • Pixel size 0.043” • Field of view 11” • Sigma=0.002 mJy after 30sec • The position of S2 wrt SgrA* estimated from orbit calculations (Ghez et al. 2003) • S2 offset from SgrA* is 0.13”N and 0.03”E • PSF has a four pixel diameter • S2 is a steady source (PSF contamination) • Great instrument because of background and PSF stability PSF has a 4-pixel diameter
Near-IR variability in 1.6, 1.87 (Paa line), 1.9mm a • Near-IR Light Curves of SgrA* (blue, red, green) • Amp: 10 % to 25% or 3 to 5 times the quiescent flux (11-14 mJy) • Duration: multiple peaks, lasting from 20 minutes to hours • Flare activity: overall fraction of activity is about 30-40% of the observed time (background 8.9 mJy) b c d e
Submillimeter 0.87mm and 0.45mm Emission (CSO) September Campaign • Variability with maximum: 4.6Jy and minimum: 2.7 Jy • Likely to be due to hourly than daily variability
IR (1.6-1.9mm) vs. X-Ray (September Campaign) NIR X-ray X-ray NIR
Simultaneous X-ray and NIR flare • NIR due to Synchrotron: tnir= 40min, Beq=10G, Ee=1.1 GeV • X-Rays due to Synchrotron: tnir=1min, B=10G, Ee=10 GeV • X-Rays due to ICS: diameter=10Rsch, F850mm=4Jy, Ee=1GeV • Ex=2x10-12 erg/cm2/s/keV, Eobs=1.2x10⁻¹² erg/cm2/s/keV • Spectral index between near-IR and X-rays is a = -1.35 bu in near-IR and X-rays , a =-0.6 • If a is flatter by 0.2, the X-ray flux is reduced by a factor of 2, so no X-ray counterpart is detected. • ICS with a =-0.6 produces soft g-ray emission with L = 7.6x1034 erg/s (2-20 keV) which is 5 times lower than observed
Lomb-Scargle periodogram searches for periodicity • Significant power with a period of ~ 1.3h and ~ 30min • a/M=0 • (r/M)orbit= 6Rsch • The same scale size as the region of the seed photons for ICS
Radio (7mm) vs X-ray (March Campaign) X-ray • Lag time between X-ray/NIR flare and sub-mm peak 4-5 hours • Time delay between X-ray/NIR and radio peak is one day • The flux variation in sub-mm is about 30% whereas at 7mm is 10% • An expanding synchrotron source in an optically thick medium NIR Sub-mm Radio
Sub-mm and Radio Time Lags D.P. Marrone, 2005
Conclusions I • Flare correlation: simultaneous vs delayed • Correlation between a near-IR and X-ray flare: consistent with SSC (Eckart et al. 2004) • An expanding synchrotron self-absorbed blob: radio and NIR wavelengths • Evidence for a NIR flare with quasi-periodic 1-1.3h and 30min behavior • The flow always fluctuates even in its quiescent phase
Non-thermal radio continuum emission is significant (40-50%) • Excess SNRs • Stellar clusters (Arches cluster, Sgr B2) • Diffuse background emission • Magnetized Filaments Law et al. (2005)
The ripple filament: total intensity (top), polarized intensity at 6cm (bottom)
X-ray (2-8 keV) and Radio (15GHz) Images of SgrA-E X-ray Radio Sakano et al. 2003 Lu et al. 2003 Yusef-Zadeh et al. 2005
The spectrum is similar in both radio and X-ray • Using the 1200, 862 and 442 micron flux and RJ tail of Planck function • Tdust= 30-50 K • t(dust) = 0.008-0.004 • Using 25 mJy flux at 15 GHz with a=0.75, ICS flux can match the observed X-ray flux 3.2x10⁻¹⁴ ergs/ cm2/s/keV if: • Tdust =50 K, B=100 m G • Beq =140 m G for a cutoff of 10MeV
Origin of the Filaments Models: • Loop ejection from a central differentially rotating engine at the Galactic center (Heyvaerts, Norman and Pudritz 1988) • Induced electric field by the motion of molecular clouds with respect to organized poloidal magnetic field (Benford 1988) • Contraction of a rotating nuclear disk in a medium threaded by poloidal magnetic field • Cosmic Strings oscillating in a magnetized medium • Interaction of a magnetized galactic wind with molecular clouds (Shore and LaRosa 1999) • Reconnection of the magnetic field at the interaction site of molecular clouds and large-scale magnetic field (Serabyn and Morris 1994)
Magnetic Field in the Galactic Center Standard Picture for the last 20 years: • The field has a global, poloidal geometry due to the filaments orientation • The field has a milli-Gauss strength due to dynamical interaction and morphology Some Recent Problems: • A number of filaments don’t run perpendicular to the Galactic plane • Zeeman and Faraday measurements plus synchrotron lifetime • Anisotropy of scatter broadened OH/IR stars • Diffuse non-thermal emission places a limit of pervasive field < 10mmG • Diffuse X-ray emission due to ICS with Tdust=30K requires B~10 mG • Filaments not representative of the large-scale Field
A Turbulent Model of the Nonthermal Radio Filaments • The mean field is weak but strong turbulent activity amplifies the field locally • Turbulent energy is ~ two orders of magnitude higher than the disk • High velocity dispersion • Hyper-scattering medium • Analogous to hydro turbulence with vorticity and MHD simulations • B increases, produces filamentary structure until it reaches equipartition • Generation: • Amplification rate ~ eddy turnover time scale ~ 106-7 yrs • The length of the filament ~ outer scale of turbulence ~10s pcs • Expulsion: • Turbulent region is confined in GC, the field is expelled by turbulece • Diffusion time scale ~ t(diffusion) ~ L2 / h ~ 10 times the eddy turnover time scale • In the disk: • The region not confined, t(diffusion) >> eddy turnover time scale in the disk • Turbulent energy is much smaller than in the GC
B field vectors of flux tubes (yellow and red); Vortes tube (grey) Nordlund et al. (1992)
Conclusions II • ICS of the seed photons from dust cloud can explain some of the diffuse X-ray features in the GC • Although non-thermal radio filaments may have strong magnetic field, they can not be representative of the large-scale filed in the GC • A turbulent dynamo model in a highly turbulent region of the GC may explain the originof nonthermal radio filaments
The dispersion plot is minimum at ~20min • An expanding self-absorbed synchrotron source with a delay of 20min implies plasma ejection took place 54min before the 7mm peak (van der Laan 1966). • No near-IR or sub-millimeter data) • Continuous ejection?
Submillimeter 7mm and 0.45mm Emission (CSO) March Campaign
Radio (7mm) vs X-ray (March Campaign) 40, 56 or 65min delay
Spectrum of Sgr A* Sgr A*
Power Spectrum • Assuming the P= 1.3h variability is due to circular motion: • a/M=0 no spin • (r/M)orbit = (P/2 p M)2/3 = 6Rsch • (for comparison rISCO =2Rsch • The same scale size as the region where sub-mm emission is expected to peak
Light Curve of SgrA* at 1.6, 1.87 and 1.90 microns • The variation is similar in all three filters • Great instrument because of background and PSF stability