Download

1 / 11
110 likes | 334 Views
Tactile Graphics for STEM Studies. Presenter: Jeff Gardner, CEO, IRIE-AT Inc. Create new images with TactileView software:. Drawing graphics with a mouse Coordinate drawing. Create TactileView files from existing images:. Importing bitmaps Using image filters. Add braille labels:.

E N D
Tactile Graphics for STEM Studies Presenter: Jeff Gardner, CEO, IRIE-AT Inc.
Create new images with TactileView software: • Drawing graphics with a mouse • Coordinate drawing
Create TactileView files from existing images: • Importing bitmaps • Using image filters
Add braille labels: • Braille text labels • Braille math labels
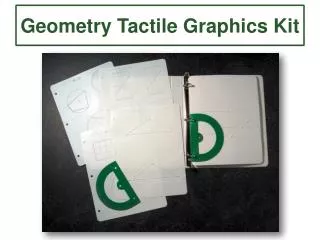
Make tactile graphs in TactileView: Graphing tool
Drawing with pad • Inclusive drawing Create new images with TactiPad
Read & write tactile/audio graphics: • Creating audio/tactile graphics • Reading audio/tactile graphics
Print/emboss from TactileView: • INDEX Braille embosser • Other braille embossers • Swell paper
Utilize other TactileView features: • Online Catalog • Online mapping tools
Find TactileView Resources: • TV support page Examples, tutorials, videos & recorded webinars • Free live webinars Irie-at.com
www.irie-at.com Questions? Thank you for your time and attention!