Download
1 / 70
700 likes | 713 Views
Tactile Graphics: Techy to Artsy. Accessing Higher Ground 2016 Lucia Hasty Robert Beach Gaeir Dietrich. Who We Are. Robert Beach AT Specialist, Kansas City Kansas Community College (913) 288-7671 * rbeach@kckcc.edu Lucia Hasty Tactile Graphics Specialist

E N D
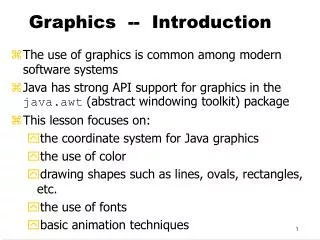
Tactile Graphics: Techy to Artsy Accessing Higher Ground 2016Lucia Hasty Robert Beach Gaeir Dietrich
Who We Are • Robert Beach • AT Specialist, Kansas City Kansas Community College • (913) 288-7671 * rbeach@kckcc.edu • Lucia Hasty • Tactile Graphics Specialist • (719) 577-4710 * lucia@tactilegraphics.org • Gaeir Dietrich • Director High Tech Center Training Unit • (408) 996-6047 * gdietrich@htctu.net
Introductions • Introduce yourselves • What production methods are you currently using? • Do you have a burning question that you need to have answered?
Burning Questions • Math • Maps • Art • Science • Geography • Geology • Geometry • Economics • Cell biology • Anatomy • Statistics • Music • Campus maps
Graphics. What to do? • Web pages, DE courses, online documents • Alt text • In books • Possibly alt text • Generally preferred • Possibly insert the caption • Preferred by some students so that the caption does not interrupt reading
Math Example • The graph of a Gaussian function is a characteristic symmetric “bell curve” shape that quickly falls off towards plus/minus infinity.
Possible Alt Text • The graphic is informational. • The graph illustrates what a bell curve is. • Alt text could be “A bell curve.” • However…what if the student does not know what a bell curve is?!?
When More Is Needed • Sometimes even a long description will not really convey the information in the graphic. • The alt text will not be sufficient for a student’s needs. • Tactile graphics to the rescue!
I have the graphic, now what? • First figure out the purpose of the graphic. • What does the graphic convey? • How much is the purpose of the graphic informational? How much decoration?
Handling Graphics • When determining the purpose, always consider the context in which the graphic is being shown. • The same graphic may have a different purpose in a different context. • Sometimes decoration • Sometimes informational
How Do I Decide?? • Does the student need to do something with the graphic or understand something from it? • Informational • Is the graphic simply entertaining or “pretty”? • Decoration
Context and Intent • What is the learning object for this graphic? • Why is it here? What is the concept? What do the authors want you to learn? • What is it that you need to do with the information? • Activity? How do you use the information?
What Next? • Do you need to do all of them? • About 10% • How do you know which ones to do? • Decision Tree • Author’s Intent • Learning Objective • Ask Prof to establish priority • Ask student his/her preference
Decision Tree • Decide if you need to do it • Figure out what you are going to do • Figure out you method for creating
No Single Right Way • There is no single way to handle graphics. • Just remember… • Keep context in mind
Working with the BANA Guidelines Tactile Graphics
What Is a Tactile Graphic? • Tactile representation of a two-dimensional graphic (drawing, chart, graph, etc.) • Tactile interpretation of a graphic • Not an exact copy—convey the same information in a totally different form • You have artistic license; you can change scale and orientation as necessary
Tactiles Needed • STEM subjects • Tactile graphics are often needed to convey complex concepts • Charts and graphs • Molecular structures • Circuits and vectors • Diagrams of systems • Maps
Microcapsule • Learning what the tools can do… • We are going to play with a blank sheet of puff paper and writing devices: • China markers • Gel pens • Soft lead pencils • Black dry erase markers
What to Consider • How are we going to convey the information represented in the graphic? • BANA Guidelines • BANA (www.brailleauthority.org) has a great decision tree for determining what you need for a tactile graphic
Tactile Representation • Simplify • Think about a young child’s coloring book • Basic outlines work well • Reduce “noise” • No shading, stippling, shadows • Limit use of “perspective” • Do not include extraneous detail • Check text to see what information is discussed • Include *only* needed information
Rule of “Fingers” • Fingers have to move to read • Make shapes at least an index-finger width wide • Except for point markers • Allow a little-finger width between labels and shapes • No extraneous lines • Limit lead lines; label areas instead
Graphic Vocabulary • Distinctly different—limit to 4 or 5 (each) • Textures • Blank is a texture • Lines • Smooth, dotted, thick, thin • Points • Do not use stars! • Labels • Use color if the students can see it, and always use tactile information, too!
Creating the Graphics • Always pretest lines and textures • Textures reproduce differently on Tiger, PIAF, Thermoform, etc. • Use heaviest lines/textures for most important elements • Place distinctly different lines/textures near each other.
Need a Key? • Always place keys before the graphic! • Use logical two-letter abbreviations, rather than numbers • Tests have shown they are easier to remember
Tactile Tips • Write out in words what the graphicis for • Figure out lines and fills before starting to draw • Develop basic axes, grids, etc. (templates) to reuse • One print graphic may be multiple tactile pages
Braille Labels on Swell Paper • Type labels in Duxbury • Enter in print view and then translate • Copy translated braille and paste into graphics program • Select labels and make them Braille font • Fonts come with Duxbury • Set font size to about 28 point • www.nationalbraille.org
Braille Codes • Separate codes for • Literary • Math and Scientific Notation (Nemeth Code) • Chemistry • Music • Foreign Language • New braille code: Unified English Braille, as of January 2016
Venn Diagram • Venn • Try different fills dots, dashes • Try the following: • Gel pen • Soft lead pencil • China marker • Black dry erase marker
Tactile Graphics GuidelinesHardcopy • Guidelines and Standards for Tactile Graphics, Supplements • Available from American Printing House for the Blind (APH) • www.aph.org • Machine: check American Thermoform or HumanWare
Other Tactile Graphics • Tooling & Collage • Puff paint, Wikki Stix • Magnets, cork board, string, felt board • Raised line drawing kit • Talking tactiles
Production Methods Techy Artsy Collage Markers and puff paper Puff paint Braille graph paper Glue sticks Draftsman Drawing Kit Sensational blackboard inTACT • Firebird (Phoenix) / Tiger / Index • Adobe Illustrator • MS Word • Paint / Gimp / Zamzar • TactileView • Toaster Technology • 3D Printers
Reality Check • Not all students are familiar with tactile graphics. • To help students learn… • Start with a 3D model • Present the same concept with collage • Now create a PIAF representation of the concept
Guided Practice • Pie Chart
From the Computer • Design graphic on computer • Illustrator, Corel Draw • Word • Print from laser printer • Make copy on swell paper using copy machine
Advantages • Can create templates • Graph paper • XY axes • Venn diagram • Basic maps • Basic outlines of biology concepts • Anything that you can reuse!
Reality Check • Easy to create “blobs” • Best uses: science, math, maps • Some success with bas relief of artwork • Lots of questions on what is useful and what is not
Technically • Requires a 3D printer • Please note: printers need to be used—sitting around is not good for them • Some libraries contain accessible materials, but it helps if you can draw • Software makes it somewhat easier, but if you have no art background, you may struggle
3D Modeling/Printing Software There are open source options (ex. Blender, Cura) Proprietary Applications AutoDesk has free apps