Download
1 / 26
260 likes | 408 Views
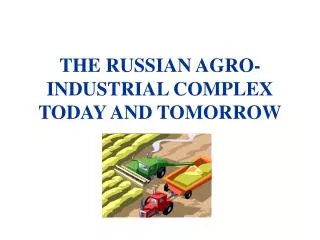
Russian Agri-Food Economy: Today and Tomorrow. Eugenia Serova Analytical Centre for Agri-Food Economics Moscow http://www.iet.ru/afe. Major results of the agrarian reforms in the 1990s dynamics farms structure land tenure competitiveness agrarian policy Prospective and problems

E N D
Russian Agri-Food Economy: Today and Tomorrow Eugenia Serova Analytical Centre for Agri-Food Economics Moscow http://www.iet.ru/afe
Major results of the agrarian reforms in the 1990s • dynamics • farms structure • land tenure • competitiveness • agrarian policy • Prospective and problems • policy, WTO • rural development • R&D
Dynamics GrowthRate of GAO
Dynamics Growth Rate in Food Industry
Dynamics Agri-Food Trade
Farms structure Land use shares by type of farms, % 1990 2000
Farms structure GAO shares by type of farms, % 1990 2000
Farms structure Volume index of agricultural production, 1990=100% Share in GAO (nominal prices), %
Farms structure Farm Production Concentration
Farms structure Frequency of cost production of grain in Rostov area, RUR/t
Number of agroholdings 133 Land per agroholding, ‘000 ha 56.4 Number of farms per agroholding 9 Land per farm, ‘000 ha 6.6 Sales per agroholding, USD mln. ~20 Sales per farm, USD mln. ~2 Sales per ha, USD ~400 Farms structure Agroholdings in 2002-2003(survey of IKAR)
Farms structure Distribution of households by gross ag. output, one rayon case
Land tenure Property titles for agricultural lands and farmlands, 2001
Farm enterprises Family farmers Households Rent 61 57 3 Own 36 42 93 Other titles 3 1 4 Total 100 100 100 Land tenure Property titles for farmlands, 2001 (survey results)
Competitiveness Production cost distribution, mode
Competitiveness Agri-food exports
Competitiveness Grain Exports
Policy Producer Support Estimates, %
Policy Import Tariff, AVE % TRQ: beef and pork Volume quota: poultry Variable import duty: sugar
USA EU-15 Japan Brazil Mexico Kenya India Russia Mean 11.9 20.5 80.1 35.6 44.4 100 116 13 Median 3.8 10.9 12 35 36 100 100 15 Min 0 0 0 0 0 100 10 0 Max 378.7 218.5 2553.6 55 450.7 100 300 50 Std. deviation 33 29.4 203.3 11.2 42.1 0 52.5 9 # of tariff lines 1769 2200 1806 942 1080 665 690 847 Policy Import Tariff Structure
Policy Ag. Budget Structure
Policy Ag. Budget Dynamic, RUR
Policy Green Box Meqasures
Prospective and problems • WTO Accession • Rural Development • Research • Human Capital