Download

1 / 13
130 likes | 267 Views
Financial Executives Networking Group. Steven H. Lipstein June 8, 2011. Total Health and Social Service Expenditures for OECD Countries, 2005. 37.6. Expenditures as % of GDP. 34.9. 33.3. 33.6. 32.8. 33.4. 32.2. 32.1. 30.6. 29.3. 29.0. 28.6. 27.6. 27.0. 26.3. 26.0. 24.9.

E N D
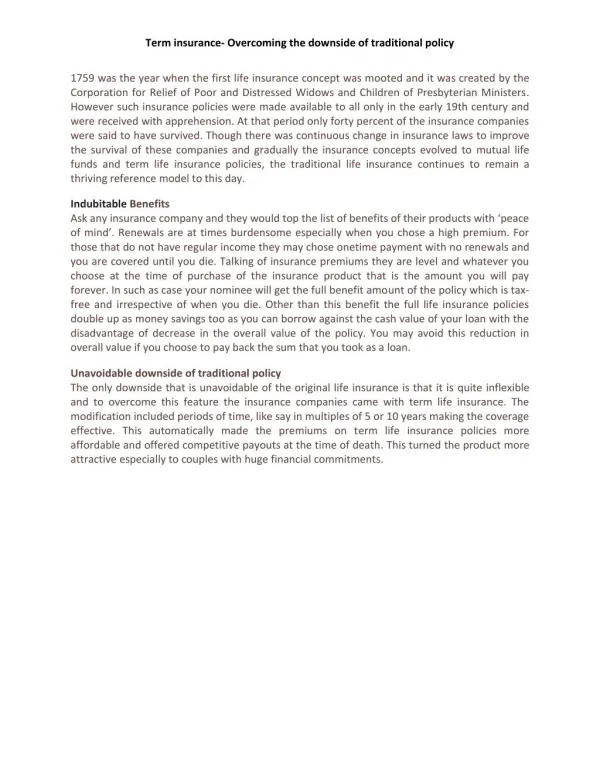
Financial ExecutivesNetworking Group Steven H. Lipstein June 8, 2011
Total Health and Social Service Expenditures for OECD Countries, 2005 37.6 Expenditures as % of GDP 34.9 33.3 33.6 32.8 33.4 32.2 32.1 30.6 29.3 29.0 28.6 27.6 27.0 26.3 26.0 24.9 24.9 24.9 24.2 23.7 24.2 23.7 23.1 21.1 20.6 19.3 18.3 12.1 10.3 *Expenditures for Portugal are from 2004 due to missing data for 2005. Source: OECD Health Data 2009 (Accessed June 2009); OECD Social Expenditure Dataset (Accessed Dec 2009); Health and Social Service Spending; Associations with Health Outcomes Article by Elizabeth Bradley, Ph.D, Benjamin Elkins, MPH, Brian Elbel, Ph.D.
Increasing Debt and Deficit Source: International Monetary Fund, World Economic Outlook Database, October 2010. Last observation: 2009.
Debt Reduction 101 Total Debt = $15T Total GDP = $15T Debt / GDP Ratio = 100% Targets: Total Debt / GDP Ratio = 60% Annual Federal Budget Deficit % < Annual GDP Growth % (About 2 – 3 %) If GDP Growth = 2.5% then 2021 GDP = $19T then… 2021 Debt at 60% of GDP = $11T Debt Reduction Required = $15T (Current Level) Minus $11T (60% of 2021 GDP) = $4 Trillion Democrats: $3T in Spending Cuts + $1T in New Taxes Republicans: $5T in Spending Cuts + $1T in New Tax Cuts $4 Trillion is the Consensus Target
Spreading the “Hurt” on the First $3 Trillion Defense = $1 Trillion Medicare/Medicaid = $1 Trillion All Other = $1 Trillion Of the $1 Trillion Attributable to Medicare/Medicaid, One-Third Allocated to Hospitals/Doctors = $330 Billion Of the $330 Billion Allocated to Hospitals, 0.1% Impact on BJC HealthCare = $330 Million (This Amount Deducted From BJC 10-Year Forecast of Cash Flow) ACOs plus HIZs plus Bundles plus all other CMMI Innovations = -$330 Million to BJC HealthCare Manage Costs to Medicare Breakeven: Supply Chain, Revenue Cycle, Enterprise Resource Management, Ancillary and Pharmacy Utilization, Length-of-Stay, Labor Inflation = PCE Inflation
BJC is Uniquely Bi-State(Missouri and Illinois) Imagine: Then: NIH (Leading Bio-Medical Research) Washington University School of Medicine (WUSM) + + Mayo Clinic (Leading Adult Specialty Care) WUSM and BJC HealthCare + + Children’s Hospital of Philadelphia (Leading Pediatric Specialty Care) WUSM and St. Louis Children’s Hospital + + Cook County Hospital (Anchor Hospital of Regional Safety Net) Barnes-Jewish Hospital and Christian + + Missouri Baptist, Christian, Alton, BJWCH, BJSPH, Progress West, Sullivan, Parkland, Clay County, Boone, BJCMG, BJC Home Care, BJC Corp. Health, BJC Behavioral Health, BJC Health Literacy and School Outreach Intermountain Health (Leading Integrated Delivery Network of Community-Based Hospitals and Doctors with Highly Regarded Patient Outcomes) Large, Balanced, Diversified, Risk-Dispersed Portfolio (Not Highly Integrated – Yet)
Standard and Poors Credit Rating For BJC HealthCare • “AA” Long-Term Rating Reflects BJC’s: • Status as a well-established, multi-hospital regional system with stable system membership, a long track record of system integration, good leverage with third-party payers, and excellent financial-risk dispersion; • Maintenance of a leading, though not dominant, share in the greater St. Louis, MO market, bolstered by broad regional and national draws at its largest facility, Barnes-Jewish Hospital, due to a reputation of clinical excellence and a long-time academic relationship with the highly respected Washington University School of Medicine (WUSM), which is one of the top recipients of federal research funding; • Strong financial profile, characterized by low leverage of 18% debt to capitalization, solid unrestricted liquidity with 286 days’ cash on hand as of December 31, 2010 with cash to long-term debt of over 3x; • Very capable management team☺that is responsible for the system’s strong financial performance in the past five years and a strong governance structure that makes system members highly unlikely to disaffiliate; • Historically strong maximum annual debt service (MADS) coverage averaging over 8x for the past five years, with fiscal 2010 MADS coverage at 11.59x; and • Continued good operating performance in fiscal 2010 with margins of 5.5%
Health Reform Impact Medicaid Expansion Private Insurance Fixes Individual Mandate Insurance Exchange “Starter Set” for Delivery and Payment Reform Incremental Change Over Time Fees Levied on Devices/Pharma I N T E R F A C E “A” I N T E R F A C E “B” Knowledge Domain Care Delivery Domain Payer Domain Domains • Medical Schools • Teaching Hospitals • NIH • Developers/Manufacturers of Drugs, Devices, Implants, Equipment and Instrumentation • Other Research Organizations • Patients • Doctors • Hospitals • Post-Acute • CMS • State Medicaid Plans • Private Insurance Plans • Employers Key Players Source: Mayo Clinic Health Policy Center, 2009, adapted.
The Payer Domain Initial growth to 180 million+ then decline as Medicare grows Will shrink to 19 million with individual mandate Will grow to 74 million with Medicaid expansion Will grow to 70 million as baby boomers reach age 65 Medicaid Private Insurance Options Uninsured Medicare Payers • About 47 million • Over 65 • Some Disabled • About 58 million • Living Below A • Poverty Threshold • Some Disabled • About 51 million • Many w/o Access to Employer-Based Coverage • About 164 million • Under 65 • Above Poverty Threshold Population
What Health Systems and Payers are Doing (w/o Informed Consent) Care Delivery Domain Payer Domain Reduce Variations and Waste of Resources Increase Value: Outcomes per Dollar Expended I N T E R F A C E “B” Reduce Price Reduce Consumption • Population Management (Non-Clinical) • Enrollment • Claims Administration • I/T (Financial) • Member Services • Actuarial Expertise • Payers • Center for Medicare/ Medicaid Services (CMS) • Essence • Aetna • Cigna • Anthem • Coventry • HealthLink • United • Washington University • BJC • BJC HealthCare Professionals / Hospitals • Washington University Physicians • BJC Medical Group • BJC Affiliated MDs • BJC Home Care • Rehabilitation Institute of St. Louis • BJC HealthCare Professionals • BJC Hospitals • Populations by Payers • Medicare Advantage • Medicare ACOs • BJC (Employer) Patient • Population Management (Clinical) • MD Leaders and Clinical Team Captains • Multi-Disciplinary Teams • IT (Clinical) • Facilities • Outcome Measurement • Payment Models (Team Rewards) • Populations by Medical Conditions • Obesity/Diabetes • Complex Patients • COPD • CHF • Stroke • Back Pain
The “Super Six” of Health Promotion and Disease Prevention What Employers Are Doing • BP <130/90 or Medicine • BS <140 or Medicine/Diet/Exercise • BC <230 or Medicine/Diet/Exercise • Medical Home • No Tobacco Use • BMI <30 or Weight Management Program • Pay a Medical Home more money (incentives) to manage patients away fromHospitals (reduce admissions / ER visits / ancillary utilization). • Pay a Pharmacy Benefit Manager (PBM) to improve medication compliance and use of less expensive generic substitutes. • Increase Employee Out-of-Pocket cost-sharing (“Skin in the Game”): • > Co-Pays • > Deductibles • > Premiums • > Reimbursement and Spending Accounts • > Donut Holes • Bjchelpforyourhealth.com And myHealthFolders.com