Download
1 / 20
200 likes | 204 Views
Quadratic Functions and Modeling. QUADRATIC FUNCTIONS. A quadratic function is one of the form: f ( x ) = ax 2 + bx + c where a , b , and c are real numbers with a ≠ 0. The graph of a quadratic function is called a parabola. STANDARD FORM OF A QUADRATIC EQUATION.

E N D
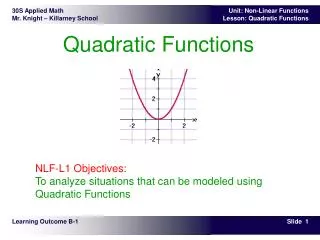
QUADRATIC FUNCTIONS A quadratic function is one of the form: f (x) = ax2 + bx + c where a, b, and c are real numbers with a ≠ 0. The graph of a quadratic function is called a parabola.
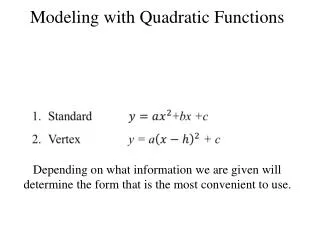
STANDARD FORM OF A QUADRATIC EQUATION The graph of is a parabola that has vertex V(h, k) and a vertical axis of symmetry. The parabola opens upward if a is positive; it opens downward if a is negative.
STANDARD FORM OF QUADRATIC FUNCTIONS Every quadratic function given by f (x) =ax2+bx+ c can be written in the standard form of a quadratic function: f (x) = a(x − h)2 + k, a ≠ 0 The graph of f is a parabola with vertex (h, k). The parabola opens up if a is positive, and it opens down if a is negative. To find the standard form of a quadratic function, use the technique of completing the square.
PUTTING A QUADRATIC FUNCTION IN STANDARD FORM • Group the x2 and x terms together. • Factor out the coefficient of x2, if necessary. • Divide the new coefficient of x by 2. • Square the number from Step 3. • Add the result of Step 4 inside the parentheses. • Take the number from Step 4 times the coefficient in front of the parentheses and subtract it outside the parentheses. • Factor the expression in the parentheses as a perfect square.
VERTEX FORMULA The vertex of the graph of f (x) = ax2 + bx + c is
SUMMARY OF PROPERTIES OF THE GRAPH OF A QUADRATIC FUNCTION • The axis of symmetry is the vertical line passing through the vertex of a parabola. • Axis of Symmetry: the line x = −b/(2a) • Parabola opens up if is a > 0; the vertex is a minimum point. • Parabola opens down if is a < 0; the vertex is a maximum point. f (x) = ax2 + bx + c, a≠ 0
MINIMUM AND MAXIMUM VALUE • If a is positive, the vertex V(h, k) is the lowest point on the parabola, and the function f has a minimum valuef (h) = k. • If a is negative, the vertex V(h, k) is the highest point on the parabola, and the function f has a maximum valuef (h) = k.
MAXIMUM OR MINIMUM VALUE OF A QUADRATIC FUNCTION • If a is positive, then the vertex (h, k) is the lowest point on the graph of f (x) = a(x − h)2 + k, and the y-coordinate k of the vertex is the minimum value of the function f. • If a is negative, then the vertex (h, k) is the highest point on the graph of f (x) = a(x − h)2 + k, and the y-coordinate k of the vertex is the maximum value of the function f. • In either case, the maximum or minimum value is achieved when x = h.
FINDING THE MINIMUM OR MAXIMUM VALUE WITH THE TI-83/84 • Enter the quadratic function in Y1. • Graph it and set the appropriate viewing window. • Press 2nd, CALC and select either 3:minimum or 4:maximum. • Use the left arrow to go to a place on the left of the maximum or minimum. Press ENTER. • Use the right arrow to go to a place on the right of the maximum or minimum. Press ENTER. • Then go near the maximum or minimum. Press ENTER.
THE QUADRATIC FORMULA The quadratic equation ax2 + bx + c = 0 has solutions This equation is called the quadratic formula.
x-INTERCEPTS OF A QUADRATIC FUNCTION • If the discriminant b2− 4ac > 0, then graph of f (x) = ax2 + bx + c has two distinct x-intercepts so it crosses the x-axis in two places. • If the discriminant b2− 4ac = 0, then graph of f (x) = ax2 + bx + c has one x-intercept so it touches the x-axis in at its vertex. • If the discriminant b2− 4ac < 0, then graph of f (x) = ax2 + bx + c has no x-intercept so it does not cross or touch the x-axis.
SOLVING A QUADRATIC EQUATION WITH THE TI-83/84 • Enter the quadratic function in Y1. • Graph it and set the appropriate viewing window. • Press 2nd, CALC and select either 2:zero. • Use the left arrow to go to a place on the left of where the graph crosses the x-axis. Press ENTER. • Use the right arrow to go to a place on the right of where the graph crosses the x-axis. Press ENTER. • Then go near where the graph crosses the x-axis. Press ENTER.
THE POSITION FUNCTION (MODEL) OF AN OBJECT MOVING VERTICALLY If an object is projected straight upward at time t= 0 from a point y0 feet above ground, with an initial velocity v0 ft/sec, then its height above ground after t seconds is given by y(t) = −16t2 + v0 t + y0 We call y0 the initial position and v0 the initial velocity.
EXAMPLE A ball is thrown straight upward from the edge of a roof that is 60 feet above the ground with an initial velocity of 45 feet per second. • Write a quadratic model for the height, y(t), of the ball above the ground. • What is the maximum height of the ball above the ground? • During what time interval will the ball be more than 75feet above the ground? • How long will the ball be in flight?
QUADRATIC POPULATION MODELS A quadratic population model is given by P(t) = P0 + bt + at2. Here, we denote the independent variable by t(time) instead of x, and the constant c by because substitution of t = 0 yields P(0) = P0. We refer to P0 as the initial population.
EXAMPLE The table below shows the census data for Gwinnett County, Georgia from 1960 through 2000. Find the best-fit quadratic model, the SSE, and the average error. Predict the population for Gwinnett County in 2010. Source: US Census Bureau
FINDING THE BEST-FIT QUADRATIC MODEL ON THE TI-83/84 • Enter t into L1 and the population into L2. • Press STAT and arrow over to CALC. • Select 5:QuadReg. • Then enter L1 and L2 (or which ever lists you have your x- and y-values stored in). • Press L1,L2. • Press ENTER.