Download
1 / 33
340 likes | 519 Views
A Macroinvertebrate IBI for the Assessment of Northeastern Lakes. Neil Kamman and Steve Fiske, VTDEC Jody Connor, NHDES Gary Lester, EcoAnalysts New England Assoc. Environmental Biologists March 2006. We have discussed some of this material before…. A word about our database

E N D
A Macroinvertebrate IBI for the Assessment of Northeastern Lakes Neil Kamman and Steve Fiske, VTDEC Jody Connor, NHDES Gary Lester, EcoAnalysts New England Assoc. Environmental Biologists March 2006
We have discussed some of this material before… • A word about our database • A (brief) refresher on our approach for developing lake biocriteria • Classification approach and methods (old) • Development of the bug IBI (new) • RIVPACS (way new)
General biocriteria approach • Reference-based approach • Begin w/ no a-priori viewpoint on metrics • Select reference and suspected-impacted sites • Measure target community using appropriate toolkit • Stratify measurements across habitats
General biocriteria approach • Infer a biological classification of reference lakes (CA, CCA) • Model the classification (DFA) • Go fishing for metrics that discriminate reference from test lakes, while being sensitive to class • Weed out redundant metrics • Retain sensitive, independent metrics • Score metrics, and create index • Test index discrimination statistically
Description of the database • 62 lakes assessed • Lakes range widely in alkalinity, size, depth, trophic status, and level of disturbance.
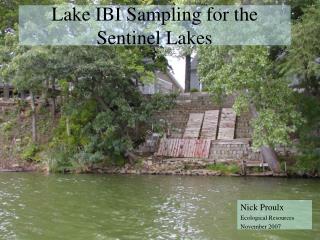
Sampling approach • Bioassessment visit takes ~1day • Lakes visited during summer index period Aug 1 to Sept 15. • Lake “trisected,” the first occurrence of each target habitat sampled once in each third, these samples composited. • Replication for QC purposes and to assess variability
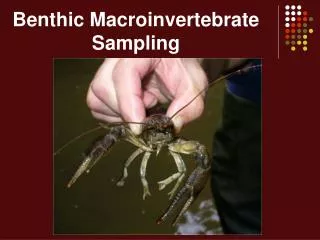
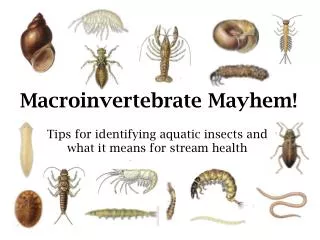
Five macroinvertebrate habitats • Rocky littoral • Timed sweep net search, 2 person, five minutes per person, at each third of the lake • Muddy littoral • Sweep net, two one-meter sweeps @5cm deep, at each third of the lake • Macrophyte beds • Sweep net, four sweeps thru plant beds, at each third of the lake
Five macroinvertebrate habitats • Sublittoral • Eckman dredge, one grab at each third of the lake, composited to comprise a whole-lake sample • Profundal • Eckman dredge, three grabs, composited, from the deepest hole of the lake.
Clearwater, low-productivity lakes Tannic, low-productivity lakes Classification of Ref. Lakes • Rocky-littoral habitat – clustering of low-productivity clearwater lakes and tannic lakes • All habitats, clustering of tannic lakes
Gradient of acidity Gradient of size Discriminant function model p=0.001 Overall error rate 15%
Metric selection process • Plot distributions of reference and test lake metrics for each habitat type • Seek out metrics that discriminate test lakes, and vary by class
A well behaved metric A two-way metric A reasonable metric Metric selection process
Information Content and Redundancy • Metric quality and information content was assessed using the Interquartile Coefficient • IQ range of Ref / Scope for detection for test • Should be < 1 • Run Spearman correlations amongst identified candidate metrics within habitats • Where metric R >0.75, reject that metric with lowest information content (largest IqC).
1 B 3 Score attributed A 5 IqC = A / B Example interquartile coefficient and scoring
Scores are summed and expressed as 0% to 100% of the maximum possible score
RIVPACS – the “O/E” metric • Essentially a richness-based supermetric • Relates Observed taxa richness to mean richness Expected based on reference lakes • Impact to aquatic biota evident under depressed richness • Observed richness > reference can indicate intermediate disturbance • Predicated on biological classification
VT Approach for lakes • Use existing classification • Calculate E from ref x hab combination • Calculate O from observed richness for each habitat surveyed, in each classified lake • O/E for each lake therefore captures habitat sampled and classification within one apples to apples measure
O matrix Generated a Pc>0% and Pc>50% model, used the Pc>0%
Automation of O/E Calculation Weighted average O/E
O/E – Ref v. test lakes • Two large, oligotrophic ref. lakes excluded from analysis • Some “benign enrichment” evident • O/E of 0.7 may be a good starting point for a “deviation from reference” X X p = 0.03
Stresses detected by the IBI and O/E • Enrichment/eutrophication – particularly in the well buffered lakes • Reservoir status • WL Fluctuation
Vermont’s approach lake protection and integrated assessment. • Assess phytoplankton community using PhytoIBI (reported here 2003). • Assess macroinvertebrate community using BugIBI and O/E (this presentation). • Assess shoreline habitat quality (per Merrell presentation yesterday). • Measure WQ. • Impairment exists when 2 of 4 or ¾ endpoints are deviating from reference or standards ??
What was not addressed • Phytoplankton IBI • Assessments of known highly-impaired lakes • Results of QC replicate assessments