Download

1 / 29
290 likes | 431 Views
Long term simulations with Chimere over Northern Italy . Marco Deserti , Enrico Minguzzi, Michele Stortini, Giovanni Bonafè, Suzanne Jongen ARPA-SIM, Area Meteorologia Ambientale. Background, problems to be solved Model set up (NINFA) 1 year hindcast, model verification

E N D
Long term simulations with Chimere over Northern Italy. Marco Deserti, Enrico Minguzzi, Michele Stortini, Giovanni Bonafè, Suzanne Jongen ARPA-SIM, Area Meteorologia Ambientale
Background, problems to be solved Model set up (NINFA) 1 year hindcast, model verification air quality assessment Scenario analysis (CLE 2020, zero EMR) Conclusions and perspectives Contents
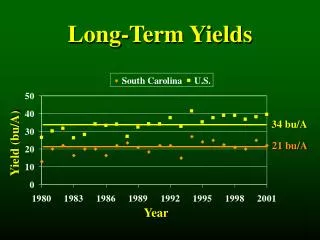
Background Po valley-Northern Italy do not comply the AQ limit values. • 2002: the Regional Government of Emilia-Romagna, the Provincial Authorities and the main Municipalities subscribed the Regional Agreement on Air Quality, focused on PM10 pollution management and aiming to reach the target values. The agreement is still valid. ARPA start to forecast air pollution to assist local authorities to decide if stop traffic before the pollution episodes. • 2003: the Emilia Romagna Regional government entrust ARPA with a task to develop a model system to assess and forecast air pollution. • 2005: the NINFA system start to be operational • 2006: the European Council invite the Repubblica Italiana to take measures to ensure that a plan or programme is prepared for attaining the limit value • 2005-2006 the government of Emilia Romagna, Friuli Venezia Giulia, Lombardia, Piemonte, Veneto, Provincia Autonoma di Trento sign the Northern Italy agreement to prevent and reduce the air pollution. A technical task force on air quality modelling is established. PM10 O3 number of exceeedances, Emilia Romagna cities
NINFA modelling system (1)Northern Italian Network to Forecast photochemical and Aerosol pollution Orography height (m) • CTM: Chimere (dust & sea salt included) • 10 km horizontal resolution, 8 vertical levels up to 500 hPa • Meteorological input : LAMI (7 km horizontal resolution) • Emissions: adapted from Corinair 2000 Italy + EMEP • Boundary conditions: Prev’air (0.5°*0.5°)
NINFA modelling system (2) NOx gridded emissions, year 2000 annual total The Chimere CTM has been adapted to Northern Italy: • interface with LM meteorological fields • modification of MH and Kz evaluation • more urban corrections to meteorological input • evaluation of plume rise for point sources The NINFA system is used for: • operational air-quality forecasts (started in October 2005, available at www.arpa.emr.it/sim) • Long-term simulations for air-quality assessment and scenario evaluation • Base case: 1-year hindcast simulation (apr 2003 – mar 2004), Meteorological input form LAMI re-analysis
Model results: base case Ozone O3, summer: average day-time concentration (left), number of days with 8-hours mean >120 μg/m3 (right) Max number of exceeedances 25 per year • The threshold for health protection is frequently exceeded • The situation is worst in rural areas in Northern Po Valley • High values in Ligurian sea are due to BC (no measurements available!!)
Model results: base case PM10 PM10: summer average (left), winter average (right) • PM10 reaches its highest value during the winter in the plain area, extending from the west sub alpine region to the North-East Adriatic coast. • higher values are located in and around the main urban agglomerates (Milano and Torino), • the smaller urban areas are not described (too coarse !), the exceedances of the threshold in urban areas are not reproduced (underestimation!)
Model validation EC Directives: 1999/30/EC, 2000/69/EC, 2002/3/EC Fonte: APAT- CTN-ACE 2004
Model verification statistics OZONE PM10 * Colico station excluded
Model verification O3: good agreement for UB and RB stations, urban effect not reproduced (coarse resolution) PM10: generally underestimated, better for the RB, less for the UB (coarse resolution), good correlation (R 0.6) • daytime ozone concentrations (1-hour and maximum daily 8-hour mean) agree very well with the observed ones, with correlation coefficients higher than 0.7 and low bias • PM10 annual mean levels are underestimated (the bias is approximately -20 μg/m3), although correlation coefficients for the daily mean are around 0.6
NINFAmodelApril – Sept 2003 Model verification: Ozone mean day in the plane, in the hills and in the mountain Observed: MOTAP The daily cycle is well reproduced by NINFA: Plane: high peak values during the day, minimum during the night, Mountain: little diurnal cycle…
Base case: PM size distribution mg/m3 D (micron) D (micron) Granulometric distribution of PM, Summer (left) and winter (right) months Milan and Bologna are urban, SPCapofiume rural in Po valley, Febbio rural in Appenines.
Model verification: PM size distribution model observed Bologna (annual mean)
Model verification: PM10 speciation * Data from CNR-ISAC (S.Fuzzi, C. Facchini) Bologna, annual mean* Caution 2003 vs 2003-2004 !
There is a lack of experimental data, a very rough comparison indicate that: organic seems to be strongly underestimated Inorganic is underestimated Dust agreement Salt: sea salt can be neglect in Bologna, other sources..? Similar results for continental (Prev’air 50 km) and regional (NINFA 10 km) simulations There is a general, although rough, agreement between observed and simulated size distribution PM10 speciation and PM size distribution in Bologna
EMISSIONS: Annual total from different data sources over Lombardia and Emilia Romagna regions CityDelta: http://aqm.jrc.it/citydelta/ CTN 2000: http://www.sinanet.apat.it
NINFA has been run over 1 year period in the hindcast mode to simulate ozone and PM10 concentration. The hindcast run is helpful to estimate the size of the polluted area and to analyze the spatial patterns of the atmospheric pollution in Northern Italy The spatial structure of the simulated fields reproduces the mountain-plain concentration gradients of pollutants. spatial patterns are linked to wind regimes, characterized by frequently stagnation of air masses in the Po Valley and to the emissions distribution, Ozone: large amount of exceedances of the target value for the protection of human health (120 μg/m3 maximum daily 8-hour mean) are in the sub alpine region and in the plane. Most exceedances (up to 120 per year) are located downwind of the main urban agglomerates (Milano and Torino). PM10: annual average reaches its highest value in the plain area, extending from the west sub alpine region to the North-East Adriatic coast. The highest values are located in and around the main urban agglomerates (Milano and Torino). Air quality assessment in Northern Italy
Preliminary results, the scenarios considered are: CLE 2020”: emission reductions of 50-60%, based on EU legislation for year 2020, have been applied on all the domain of integration. “Emilia-Romagna Zero”: to assess the maximum possible effectiveness of emission reduction policies at local scale, all emissions in Emilia Romagna region (about 20% of Po Valley surface, 15% of emissions) have been switched off. Scenario analysis
Emissions scenarios PM10 emission, 1 year total: base case (left) and current legislation scenario “CLE2020 (*)” (right) (*) CLE 2020 from EMEP
CLE 2020, Ozone Ozone: number of days with 8-hours mean >120 μg/m3 (60 ppb) (right), base case (left) and CLE (right) Max number of exceeedances 25 per year • Total NOx emissions decrease about 60% and VOC decrease about 50% over the full area • ozone summer daily mean decrease about 5% • the number of exceedances of the 120 g/m3 limit decrease about 15% • The ozone ozone limit values will not be complied !
CLE 2020, PM10 PM10 annual average, base case (left) and scenario CLE (right) • Total NOx and PM10 emissions decrease about 60% over the full area • PM10 annual mean decrease about 20% in rural areas, up to 30% in urban areas • Caution: due to the PM10 underestimation only the relative variations can be considered
Emilia Romagna Zero, Ozone Ozone: number of days with 8-hours mean >120 μg/m3 (60 ppb) (right), base case (left) and EMRZero (right) Max number of exceeedances 25 per year • Zero emissions over Emilia Romagna, total emissions (VOC, NOx,) decrease about 13% over the full area • ozone summer daily mean not change • the number of exceedances of the 120 g/m3 limit decrease about 15% in the Bologna area • The effectiveness of local actions is very poor for ozone!
Emilia Romagna Zero, PM10 PM10 annual average, base case (left) and scenario EMRZero (right) • Zero Emissions over Emilia Romagna, total emissions (VOC, NOx, SOx, PM10) decrease about 13%, NH3 decrease about 17%, over the full area • PM10 annual mean is substantially reduced (decrease 30-40% far from the boundaries) • Local actions could be effective to reduce PM10 concentration!
The NINFA system is operational since October 1995, forecast and hindcast are daily available on the WEB (www.arpa.emr.it/sim ) NINFA has been applied to assess Ozone and PM10 air pollution in Northern Italy (Base case 2003-2004) The comparison with experimental data show that NINFA works well for ozone while PM10 is underestimated, even if correlation with observed data is rather good. Main processes and dynamics are reproduced. PM10 should be improved. Two additional 12 months simulations have been performed: “CLE 2020” and “Emilia_Romagna Zero” to assess the maximum possible effectiveness of emission reduction policies at local scale, Actions to improve the system are ongoing: a finer resolution (5 km) Emilia-Romagna version will be nested inside the Northern Italy coarse model (10 km), the emission inventory will be upgraded, increase of PM10 emissions estimation are expected, new experimental data will be collected and used for model verification and improvement. Conclusions
Risultati: PM10, caso base Speciation of PM10, Milan, Summer (left) and winter (right) months
Risultati: PM10, caso base Granulometric distribution of PM10, Milan, Summer (left) and winter (right) months Bla
Mixing height Average mixing height during winter months, estimated by Chimere pre-procesor. Default configuration (left) and setup adapted to Northern Italy (right)
Note - Modifications to Hmix: disabled enhancement below clouds, modified nocturnal scheme (now Mahrt 2002, function of U* only), increased minimum value in urban cells, introduced a maximum value of 2500 m - Plume rise scheme: taken from CAMx model (Turner 1986, modified )