Download

1 / 24
240 likes | 269 Views
This study compares the precipitation verification results over Northern Italy using different models and statistical indices. It also analyzes the performance of the LAMI model with prognostic precipitation over Piedmont basins from August 2004 to July 2005. The study examines seasonal trends, diurnal cycles, and performance differences in different geographical areas. Soil moisture analysis and the role of forecast models in predicting precipitation patterns are also considered.

E N D
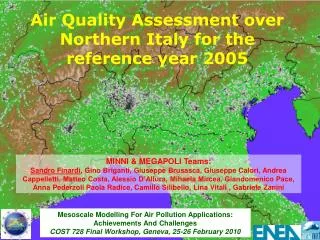
Latest results in the precipitation verification over Northern Italy Elena Oberto, Marco Turco, Paolo Bertolotto (*) ARPA Piemonte, Torino, Italy
Comparative precipitation verification • • LM-DWD, aLMo, LAMI over Northern Italy • LAMI vs. LAMI prog prec over Piedmont Objectives • Verification over NI: • Seasonal daily cycle and seasonal statistical indices over 47 basins: 00/12 UTC run, forecast time: +24, +48, 6h diurnal cycle • Seasonal statistical indices over mountain/plain basins • Seasonal statistical indices over western/eastern basins • LAMI study: • LAMI vs. LAMI with prog. Prec verification: performance comparison over Piedmont basins from August 2004 to July 2005 • Seasonal statistical indices and cumulated precipitation maps • Application to a foehn case study.
Piedmont: percentage valid data (August 2004-July 2005) Eastern Italian basins Mountain Italian basins Plain Italian basins Western Italian basins
5 mm Seasonal trend over NI: run00
10 mm Seasonal trend over Northern Italy- run00
5 mm Seasonal trend over NI: run12
10 mm Seasonal trend over Northern Italy: different performance over plain and mountainous areas
10 mm Seasonal trend over Northern Italy: different performance over western and eastern areas
General worsening during last seasons, exp. DJF’05: • there is an increasing in QPF (due to the introduction of prog. cloud ice scheme?), BUT • DJF ’04 ~ 400 events > 10mm/24h on the average • DJF ’05 ~ 150 events > 10mm/24h on the average 110 on the East, 40 on the West • 1) How many does an halved statistics affect the results interpretation? • 2) How much is more difficult to estimate quantitatively the precipitation • during a particularly dry winter with respect to a “normal” winter? • The role of soil moisture analisys during summer seasons seems to be decisive in term of QPF (better BIAS index for LM-DWD in JJA) but not in term of capability to localize and predict accurately the precipitation pattern (ETS very low) • Big differences in term of BIAS between mountainous and plain areas: we obtain a greater overestimation on the mountain, except for LAMI in DJF’05: only LAMI runs without prog. prec.: to investigate the behaviour of prognostic precipitation during very dry season. • Different trend on the West and East areas: • aLMo general increasing in QPF, but much greater overestimation on Western areas • LK-DWD general increasing in QPF during last seasons, slightly greater overestimation on Western areas • LAMI behaviour similar to the other version, but not for DJF’05: big overestimation on the East where we have the greater majority of precipitation cases. Remarks
LAMI study • “PROGNOSTIC PRECIPITATION” version (lam00) vs. STANDARD (nud00) • Domain study: Piedmont basins (with Ticino raingauges) • Period study: August 2004-July 2005
Aug’04/Jul’05 BIAS and ETS: Forecast time D+2 The error bars indicates 2.5th and 97.5th percentiles of resampled distribution, applied to the "reference" model. Lam00 prog prec version Nud00 standard version
Aug’04/Jul’05 HRR and FAR: Forecast time D+2 Lam00 prog prec version Nud00 standard version
SON ‘04 BIAS and ETS: Forecast time D+2 Lam00 prog prec version Nud00 standard version
SON ‘04 HRR and FAR: Forecast time D+2 Lam00 prog prec version Nud00 standard version
November 2004 LAMI prognostic rain scheme observed LAMI “standard”
DJF ‘05 BIAS and ETS: Forecast time D+2 Lam00 prog prec version Nud00 standard version
DJF ‘05 HRR and FAR: Forecast time D+2 Lam00 prog prec version Nud00 standard version
Case study during a strong foehn event: 21-22 Jan’05 LAMI prognostic rain scheme Observed LAMI “standard”
MAM ‘05 BIAS and ETS: Forecast time D+2 Lam00 prog prec version Nud00 standard version
MAM ‘05 HRR and FAR: Forecast time D+2 Lam00 prog prec version Nud00 standard version
Seasonal comparison LAMI vs. LAMI prog Scale (mm)
Remarks • Aug’04-Jul’05 globally for high thresholds the BIAS is significantly reduced • Seasonal trend: the BIAS reduction is noticeable during wet season and for moderate/strong precipitation • The prognostic scheme seems to not solve completely the underestimation downwind but it reduces the overestimation upwind • DJF ’05 slightly worsening of LAMI prog., particularly over north-western alpine chain, that represents in this case the “downwind side” (north-western flux as prevailing synoptic situation)!