Download
1 / 21
240 likes | 467 Views
An Introduction to PAST. With thanks to Oyvind Hammer, Dave Harper and P. D. Ryan. Getting PAST. PAST runs under Windows XP, Vista and Windows 7. No Mac OS versions http://folk.uio.no/ohammer/past/ Download PAST PDF manual Trial data files and tutorials. Example PAST manual page.

E N D
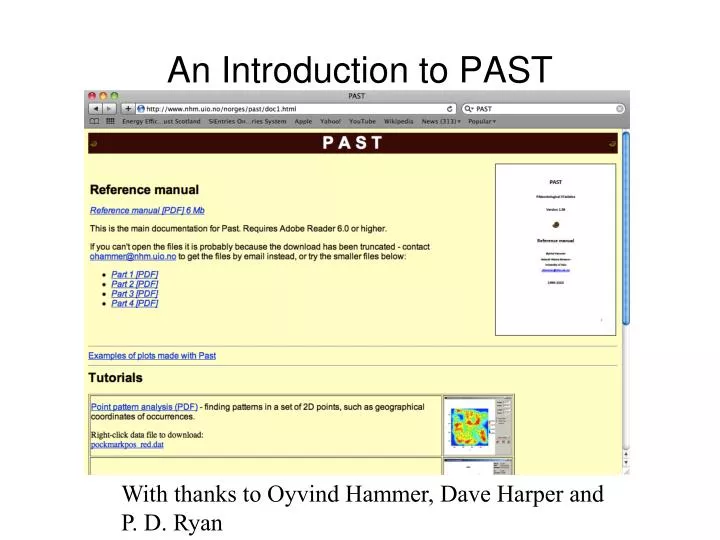
An Introduction to PAST With thanks to Oyvind Hammer, Dave Harper and P. D. Ryan
Getting PAST • PAST runs under Windows XP, Vista and Windows 7. • No Mac OS versions • http://folk.uio.no/ohammer/past/ • Download PAST • PDF manual • Trial data files and tutorials
Example PAST manual page Excellent summaries of performance of various methods
Capabilities of PAST • Wide variety of graphing capabilities • Curve fitting • Parametric and non-parametric tests • Diversity analyses • Abundance model fits • Multivariate statistics • Time series analysis • Morphometics/geometric analyses • Parsimony analysis (cladistics) • Quantitative biostratigraphy • Gridding
PAST interface • Although it looks like Excel it is not! • Some subtle differences • Edit buttons • For analyses you MUST highlight your data block • Often need to add an extra column or reorder data
PAST has many relevant tools for palaeobiodiversity analysis • Diversity menu • Alpha • - Beta • SHE • Rarefaction • Abundance modelling (Modelling menu) • Time series analysis • Considerable spatial analytical capabilites
Beta diversity example Focal quadrat Neighbouring quadrat • Beta or turnover diversity reflects change in taxonomic composition between sites • Just as with alpha, lots of metrics proposed • Koleff et al. (2003) • Just as with alpha (within-habitat/point) diversity, lots of metrics proposed • Koleff et al. (2003) a = total number of shared species b = number of species in neighbouring quadrat NOT present in focal quadrat c = species present in focal quadrat but not in neighbouring Krebs (1999)
Beta diversity example • Expressed as percentages • Plot on ternary diagram a’ = percentage of shared species b = percentage of species in neighbouring quadrat NOT present in focal quadrat c = precentage of species present in focal quadrat but not in neighbouring Krebs (1999) Koleff et al. (2003)
Biodiversity analyses: Rows by columns A B 0 1 1 1 0 1 2
Biodiversity analyses: Rows by columns A B 0 0 1 1 0 1 2
Carboniferous ammonoids of Scotland (Currie 1954) Exercise: Examine the beta diversity among Carboniferous basins in Midland Valley of Scotland A tip: In any biogeographic analysis sites with only one taxon or taxa that occur in only one locality are at best uninformative about relationships and at worst confound analyses Fife Glasgow Dunbar Lothian Ayr http//:www.bgs.ac.uk
Operation in PAST Import data file Under diversity analysis select Beta diversity Run analysis What does the output mean?
Parsimony analysis of Endemicity (Rosen & Smith 1988) Tectonics from Fossils! • Developed by Brian Rosen and Andrew Smith (NHM) • Although it uses parsimony analyses it does not require organismal phylogenies • Fell out of favour • Revived interest among ecologists
Take your matrix and run it in your favourite parsimony analysis program Matrix PAUP PAST APE TNT MacClade A B C CI RI Support
PAE also drove interest in time-slicing Time 3 Time 2 Time 1 Historical biology as a palimpsest
Reanalysis of Brayard et al. 2007Early Triassic ammonoid data with PAE Griesbachian
Reanalysis of Brayard et al. 2007Early Triassic ammonoid data with PAE Dienerian