Download
1 / 17
200 likes | 524 Views
Two-way ANOVA Example. Analgesic study with three treatments crossed with gender. Data on pain and factor levels. male C 12.4 female A 7.69 male C 14.0 female A 9.69 male C 11.6 female A 8.89 female A 6.94 female A 2.13 female A 7.26 female A 5.87 male B 12.9 female C 12.2

E N D
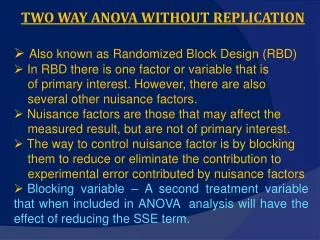
Two-way ANOVA Example Analgesic study with three treatments crossed with gender.
Data on pain and factor levels male C 12.4 female A 7.69 male C 14.0 female A 9.69 male C 11.6 female A 8.89 female A 6.94 female A 2.13 female A 7.26 female A 5.87 male B 12.9 female C 12.2 female A 7.20 male C 13.9 male A 8.18 male B 16.6 female C 9.41 male C 11.2 female B 8.35 male A 7.24 female A 6.81 male B 9.81 female A 6.67 female A 6.98 female A 7.07 female C 2.40 male B 7.84 female B 3.84 male B 9.42 male A 7.00 male A 7.00 female A 5.00 male A 8.00
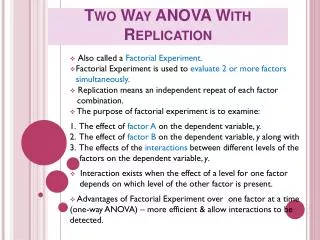
Factors and Response Variable • Response variable, Y, is Pain index • Gender is one factor (sometimes called independent variable) • Drug (type of analgesic agent) is the other factor • All factor combinations are considered
Statistical Model So that Pain level is modeled as a linear function of Factor levels.
ANOVA table Source DF Sum of Squares F Ratio Prob> F gender 1 73.8082 12.6378 0.0014* drug251.05914.37130.0227* drug*gender 2 30.5427 2.6148 0.0916
What if we had dropped the interaction from the model since it was not significant? The Drug Effect is now close to being not significant. Why? Because we have inflated our MSE. In ANOVA, the model you originally fit is generally the model you use for reporting significance.
Range Test on Main Effect of Drug Level Least Sq Mean C A 10.316622 B A B 8.710767 A B 7.134856 Levels not connected by same letter are significantly different.
What did Interaction term test? The interaction tests whether an “Additive Model” is adequate. The Additive model only contains Main Effects and has the form: Another way to think about Interaction is to look at Interaction Plots.
Goodness of Fit Goodness-of-Fit Test Shapiro-Wilk W Test W Prob<W 0.970483 0.4936 Note: Ho = The data is from the Normal distribution. Small p-values reject Ho.
Box-Cox Transformation(lambda which minimizes SSE is optimal)