Download
1 / 61
610 likes | 726 Views
Effects of Handling Procedures and Transport Conditions on Welfare and Meat Quality of Pigs Tina Widowski Department of Animal & Poultry Science, University of Guelph. ~31.5 million pigs were marketed in Canada in 2008 (Stats Canada)

E N D
Effects of Handling Procedures and Transport Conditions on Welfare and Meat Quality of Pigs Tina Widowski Department of Animal & Poultry Science, University of Guelph
~31.5 million pigs were marketed in Canada in 2008 (Stats Canada) • Most of these were transported to reach their end market • Estimated 0.08 - 0.22% of them died before reaching their destination (Haley et al, 2008) • Many more experienced non-fatal stress
Factors Affecting the Stress Response Genetics Experience Health Nutrition Mixing/ grouping Ambient temperature Loading density Transport Lairage time Handling Truck/ facility design Courtesy: M. Ellis … Multifactorial
Recent & ongoing research • Epidemiological studies on mortality • Focused studies on behaviour, physiology and meat quality due to • Trailer design and transport conditions • Pigs and handling practices
In-Transit Losses • Researchers • Charles Haley • Cate Dewey • Bob Friendship • Department of Population Medicine, Ontario Veterinary College, University of Guelph • Tina Widowski
Factors Associated with In-Transit Losses of Market Pigs in Ontario 2001 (Haley et al, CJVR, 2008) • Retrospective study of transport records from all pigs marketed in Ontario • 4.76 million pigs from 4159 producers, marketed through 117 transport companies to 33 abbatoirs in Canada and USA • Pigs shipped to Ontario (82%), Quebec (13%), USA (4%), Manitoba (0.08%)
Factors Associated with In-Transit Losses of Market Pigs in Ontario 2001 (Haley et al, CJVR, 2008) • In-transit loss = 0.017% (16.7/10,000 pigs) • Farm of origin (25%) > abbatoir (16%) > transporter (8%) explained variance in losses • Temperature-humidity index (combination of temperature and humidity) was highly predictive of losses
Transport Losses of Market Pigs in Ontario 2001-2003 The highest losses in occurred in July 2003 - coincided with highest environmental temps (avg. 30.10C) From Charles Haley 2005
Pan-Canadian Pig Transport ProjectEffects of Vehicle Design & Handling Procedures RESEARCHERS: Harold Gonyou (Lead) - Prairie Swine Centre, Saskatchewan Luigi Faucitano (Lead), Agriculture Canada, Quebec Renee Bergeron, Alfred College, Ontario Trever Crowe, University of Saskatchewan Laurie Connor, University of Manitoba Cate Dewey, University of Guelph Nora Lewis, University of Manitoba Stephanie Torrey, Agriculture Canada, Quebec Tina Widowski, University of Guelph GRADUATE STUDENTS: Jorge Correa, Laval University Emily Toth, University of Guelph
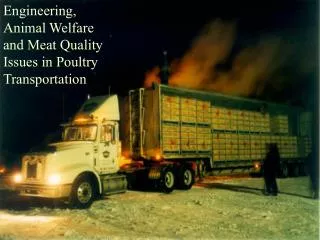
Field Studies Eastern Trials (Quebec) Short hauls (2 hours) June-July 2007 and Feb-March 2008 2 different trailer designs Western Trials (Saskatoon to Brandon) “Long” hauls (6 hours driving + 2 hours driver rest period) Jan-Feb 2008 and June-July 2008
Eastern Trials(Quebec)2 Trailer Designs 3-deck pot belly (V230) 2-deck hydraulic lift (10R)
Eastern Trials(Quebec)2 Trailer Designs • 6 weekly trials each season • 313 pigs shipped each week (~118 kg)
Environmental Temperature iButtons were suspended from the ceiling in several locations within each compartment
The iButton Data Logger Technology developed by Dallas SemiConductor™ Used in poultry transport (Crowe, unpublished data) Used once in Missouri for pig transport (Carr et al 2008,) 17mm X 6mm stainless steel can 15 - 46°C range, 0.125°C accuracy 2048 loggings, adjustable timing
Number of Pigs Sampled Weekly 14 pigs 3 5 0 3 10W 3 2 0 5 3 4 28 pigs 4 3 4 3 PB 14 + 28 = 42
Core Body Temperature iButton administered orally and then recovered from viscera at slaughter
Blood Measures & Meat Quality Stress Measures Creatine phosphokinase (CPK) Lactate Cortisol Loin & Ham pH Lightness Drip Loss Meat Quality Classification
Preparation Procedure Twelve hours prior to loading pigs were: weighed belted for heart rate measurement iButton administered ear tagged and individually tattooed mixed into shipping pens
Transport Process Loading began at 3am Duration of loading 3.5 to 4 hours (PB always loaded first) No prod usage • The duration of transport was two hours • Both trucks left the farm and travelled together
The trucks waited at the plant ~15 minutes Then were unloaded and the pigs were lairaged for 1 hour
Trailer Temperatures Average for all compartments at single point in time * * *Trucks were different P<0.05 Gonyou et al, unpublished
The effect of the period of transport on mean body temperature of pigs in two trucks * * Tr*Pd p< 0.001 PB always loaded 1st with wait of ~ 1 hour (Toth-Tamminga et al 2008)
The effect of compartment within the PB during “Stationary” A B 1 = 4 > all other compartments p< 0.02 (Toth-Tamminga et al 2008)
228 pigs PB
Duration of Unloading * (Torrey et al 2008) *Trucks were different P<0.01
Duration Unloading (Torrey et al 2008) a,b P<0.04 x,y P<0.08 a b x b y 4 3 2 1 4 2 3 6 5 1 8 7
Blood Values P<0.06 P<0.07 mmol/L U/L x 100 (Correa et al 2008)
Meat Quality (Correa et al 2008)
Factors Leading to Variation in Pork Quality RESEARCHERS: Peter Purslow Kees deLange Ira Mandel Jim Squires Andy Robinson Tina Widowski GRADUATE STUDENT: Jennifer Brown
Walking the Pens • 0,1, 2 or 3 times per week beginning ~12 weeks prior to shipping • Handler entered the pen and while holding a pig board, made one complete circuit around the pen • Average time in the pen was 39 .3 seconds (Brown et al, 2006)
Behaviour in Home Pen • One day each week, the responses of pigs to the handler entering the pen were recorded % of pigs that showed “escape” - pigs rapidly moved away from the handler often piling along the back of the pen % of pigs that “approached” - pigs attempted to nose the board, boots or legs of the handler (Brown et al, 2006)
% Pigs Showing “Escape” As Handler Entered Home Pen a b (P<0.05) b Week of Trial (Brown et al, 2006)
% Pigs “Approaching” As Handler Entered Home Pen b b a (P<0.05) Week of Trial (Brown et al, 2006)
BUT does a difference in fearfulness of people in the home pen translate into better handling when pigs are shipped?
Behaviour Measures At Plant - Time in the pen (seconds) - Pig behaviour in pen (frequency) Avoidance, falling, jamming - Human intervention (frequency) Pushes, slaps, prods (Brown et al, 2006)
Effect of walking pens on frequency of jamming in the crowd pen a ab b b Data from Farm 1 a,b Means are different P<.05 (Brown et al, 2006)
Effect of walking pens on time in the crowd pen (seconds) a b b b Data from Farm 2 a,b Means are different P<.05 (Brown et al, 2006)