Download
1 / 1
10 likes | 124 Views
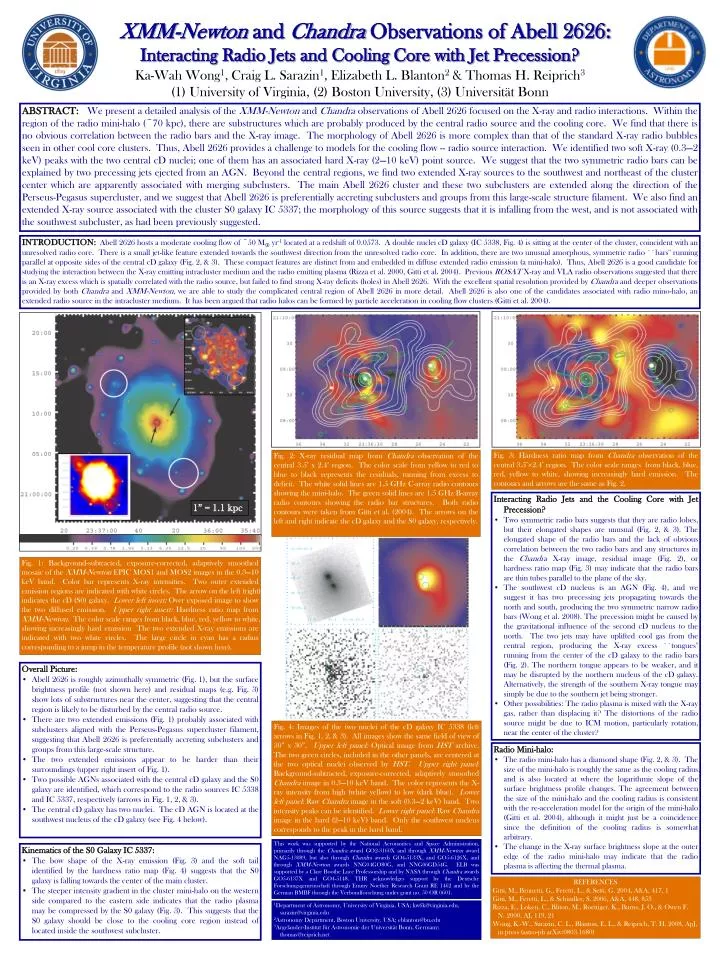
1” = 1.1 kpc. XMM-Newton and Chandra Observations of Abell 2626: Interacting Radio Jets and Cooling Core with Jet Precession?. Ka-Wah Wong 1 , Craig L. Sarazin 1 , Elizabeth L. Blanton 2 & Thomas H. Reiprich 3 (1) University of Virginia, (2) Boston University, (3) Universität Bonn.

E N D
1” = 1.1 kpc XMM-Newton and Chandra Observations of Abell 2626: Interacting Radio Jets and Cooling Core with Jet Precession? Ka-Wah Wong1, Craig L. Sarazin1, Elizabeth L. Blanton2 & Thomas H. Reiprich3 (1) University of Virginia, (2) Boston University, (3) Universität Bonn ABSTRACT:We present a detailed analysis of the XMM-Newton and Chandra observations of Abell 2626 focused on the X-ray and radio interactions. Within the region of the radio mini-halo (~70 kpc), there are substructures which are probably produced by the central radio source and the cooling core. We find that there is no obvious correlation between the radio bars and the X-ray image. The morphology of Abell 2626 is more complex than that of the standard X-ray radio bubbles seen in other cool core clusters. Thus, Abell 2626 provides a challenge to models for the cooling flow -- radio source interaction. We identified two soft X-ray (0.3—2 keV) peaks with the two central cD nuclei; one of them has an associated hard X-ray (2—10 keV) point source. We suggest that the two symmetric radio bars can be explained by two precessing jets ejected from an AGN. Beyond the central regions, we find two extended X-ray sources to the southwest and northeast of the cluster center which are apparently associated with merging subclusters. The main Abell 2626 cluster and these two subclusters are extended along the direction of the Perseus-Pegasus supercluster, and we suggest that Abell 2626 is preferentially accreting subclusters and groups from this large-scale structure filament. We also find an extended X-ray source associated with the cluster S0 galaxy IC 5337; the morphology of this source suggests that it is infalling from the west, and is not associated with the southwest subcluster, as had been previously suggested. INTRODUCTION:Abell 2626 hosts a moderate cooling flow of ~50 M yr-1 located at a redshift of 0.0573. A double nuclei cD galaxy (IC 5338, Fig. 4) is sitting at the center of the cluster, coincident with an unresolved radio core. There is a small jet-like feature extended towards the southwest direction from the unresolved radio core. In addition, there are two unusual amorphous, symmetric radio ``bars'' running parallel at opposite sides of the central cD galaxy (Fig. 2, & 3). These compact features are distinct from and embedded in diffuse extended radio emission (a mini-halo). Thus, Abell 2626 is a good candidate for studying the interaction between the X-ray emitting intracluster medium and the radio emitting plasma (Rizza et al. 2000, Gitti et al. 2004). Previous ROSAT X-ray and VLA radio observations suggested that there is an X-ray excess which is spatially correlated with the radio source, but failed to find strong X-ray deficits (holes) in Abell 2626. With the excellent spatial resolution provided by Chandra and deeper observations provided by both Chandra and XMM-Newton, we are able to study the complicated central region of Abell 2626 in more detail.Abell 2626 is also one of the candidates associated with radio mino-halo, an extended radio source in the intracluster medium. It has been argued that radio halos can be formed by particle acceleration in cooling flow clusters (Gitti et al. 2004). Fig. 3: Hardness ratio map from Chandra observation of the central 3.5’2.4’region. The color scale ranges from black, blue, red, yellow to white, showing increasingly hard emission. The contours and arrows are the same as Fig. 2. Fig. 2: X-ray residual map from Chandra observation of the central 3.5’ x 2.4’ region. The color scale from yellow to red to blue to black represents the residuals, running from excess to deficit. The white solid lines are 1.5 GHz C-array radio contours showing the mini-halo. The green solid lines are 1.5 GHz B-array radio contours showing the radio bar structures. Both radio contours were taken from Gitti et al. (2004). The arrows on the left and right indicate the cD galaxy and the S0 galaxy, respectively. • Interacting Radio Jets and the Cooling Core with Jet Precession? • Two symmetric radio bars suggests that they are radio lobes, but their elongated shapes are unusual (Fig. 2, & 3). The elongated shape of the radio bars and the lack of obvious correlation between the two radio bars and any structures in the Chandra X-ray image, residual image (Fig. 2), or hardness ratio map (Fig. 3) may indicate that the radio bars are thin tubes parallel to the plane of the sky. • The southwest cD nucleus is an AGN (Fig. 4), and we suggest it has two precessing jets propagating towards the north and south, producing the two symmetric narrow radio bars (Wong et al. 2008). The precession might be caused by the gravitational influence of the second cD nucleus to the north. The two jets may have uplifted cool gas from the central region, producing the X-ray excess ``tongues'' running from the center of the cD galaxy to the radio bars (Fig. 2). The northern tongue appears to be weaker, and it may be disrupted by the northern nucleus of the cD galaxy. Alternatively, the strength of the southern X-ray tongue may simply be due to the southern jet being stronger. • Other possibilities: The radio plasma is mixed with the X-ray gas, rather than displacing it? The distortions of the radio source might be due to ICM motion, particularly rotation, near the center of the cluster? Fig. 1: Background-subtracted, exposure-corrected, adaptively smoothed mosaic of the XMM-Newton EPIC MOS1 and MOS2 images in the 0.3—10 keV band. Color bar represents X-ray intensities. Two outer extended emission regions are indicated with white circles, The arrow on the left (right) indicates the cD (S0) galaxy. Lower left insert: Over exposed image to show the two diffused emission. Upper right insert: Hardness ratio map from XMM-Newton. The color scale ranges from black, blue, red, yellow to white, showing increasingly hard emission The two extended X-ray emissions are indicated with two white circles. The large circle in cyan has a radius corresponding to a jump in the temperature profile(not shown here). • Overall Picture: • Abell 2626 is roughly azimuthally symmetric (Fig. 1), but the surface brightness profile (not shown here) and residual maps (e.g. Fig. 3) show lots of substructures near the center, suggesting that the central region is likely to be disturbed by the central radio source. • There are two extended emissions (Fig. 1) probably associated with subclusters aligned with the Perseus-Pegasus supercluster filament, suggesting that Abell 2626 is preferentially accreting subclusters and groups from this large-scale structure. • The two extended emissions appear to be harder than their surroundings (upper right insert of Fig. 1). • Two possible AGNs associated with the central cD galaxy and the S0 galaxy are identified, which correspond to the radio sources IC 5338 and IC 5337, respectively (arrows in Fig. 1, 2, & 3). • The central cD galaxy has two nuclei. The cD AGN is located at the southwest nucleus of the cD galaxy (see Fig. 4 below). Fig. 4: Images of the two nuclei of the cD galaxy IC 5338 (left arrows in Fig. 1, 2, & 3). All images show the same field of view of 30” x 30”. Upper left panel: Optical image from HST archive. The two green circles, included in the other panels, are centered at the two optical nuclei observed by HST. Upper right panel: Background-subtracted, exposure-corrected, adaptively smoothed Chandra image in 0.3—10 keV band. The color represents the X-ray intensity from high (white yellow) to low (dark blue). Lower left panel: Raw Chandra image in the soft (0.3—2 keV) band. Two intensity peaks can be identified. Lower right panel: Raw Chandra image in the hard (2—10 keV) band. Only the southwest nucleus corresponds to the peak in the hard band. • Radio Mini-halo: • The radio mini-halo has a diamond shape (Fig. 2, & 3). The size of the mini-halo is roughly the same as the cooling radius, and is also located at where the logarithmic slope of the surface brightness profile changes. The agreement between the size of the mini-halo and the cooling radius is consistent with the re-acceleration model for the origin of the mini-halo (Gitti et al. 2004), although it might just be a coincidence since the definition of the cooling radius is somewhat arbitrary. • The change in the X-ray surface brightness slope at the outer edge of the radio mini-halo may indicate that the radio plasma is affecting the thermal plasma. This work was supported by the National Aeronautics and Space Administration, primarily through the Chandra award GO2-3160X and through XMM-Newton award NAG5-13089, but also through Chandra awards GO4-5133X, and GO5-6126X, and through XMM-Newton awards NNG04GO80G, and NNG06GD54G. ELB was supported by a Clare Boothe Luce Professorship and by NASA through Chandra awards GO5-6137X and GO4-5148. THR acknowledges support by the Deutsche Forschungsgemeinschaft through Emmy Noether Research Grant RE 1462 and by the German BMBF through the Verbundforschung under grant no. 50 OR 0601. • Kinematics of the S0 Galaxy IC 5337: • The bow shape of the X-ray emission (Fig. 3) and the soft tail identified by the hardness ratio map (Fig. 4) suggests that the S0 galaxy is falling towards the center of the main cluster. • The steeper intensity gradient in the cluster mini-halo on the western side compared to the eastern side indicates that the radio plasma may be compressed by the S0 galaxy (Fig. 3). This suggests that the S0 galaxy should be close to the cooling core region instead of located inside the southwest subcluster. REFERENCES Gitti, M., Brunetti, G., Feretti, L., & Setti, G. 2004, A&A, 417, 1 Gitti, M., Feretti, L., & Schindler, S. 2006, A&A, 448, 853 Rizza, E., Loken, C., Bliton, M., Roettiger, K., Burns, J. O., & Owen F. N. 2000, AJ, 119, 21 Wong, K.-W., Sarazin, C. L., Blanton, E. L., & Reiprich, T. H. 2008, ApJ, in press (astro-ph arXiv:0803.1680) 1Department of Astronomy, University of Virginia, USA; kw6k@virginia.edu, sarazin@virginia.edu 2Astronomy Department, Boston University, USA; eblanton@bu.edu 3Argelander-Institut für Astronomie der Universität Bonn, Germany; thomas@reiprich.net