Download
1 / 46
470 likes | 627 Views
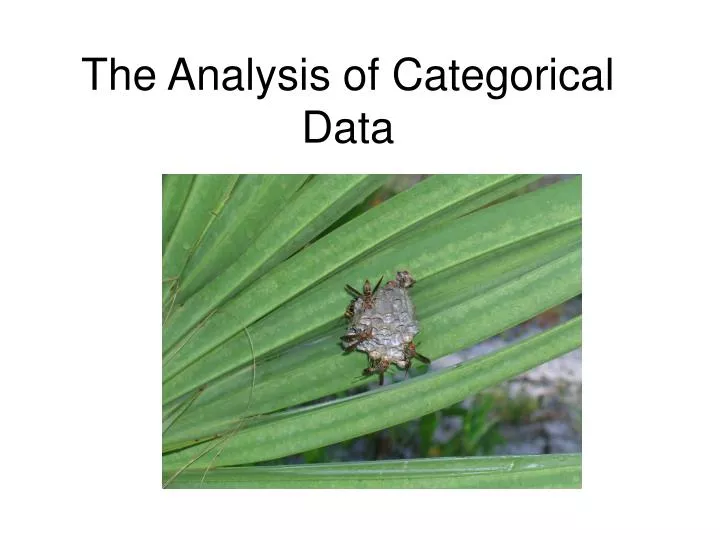
The Analysis of Categorical Data. Categorical variables. When both predictor and response variables are categorical: Presence or absence Color, etc. The data in such a study represents counts –or frequencies - of observations in each category. Analysis. Two way Contingency Tables.

E N D
Categorical variables • When both predictor and response variables are categorical: • Presence or absence • Color, etc. • The data in such a study represents counts –or frequencies- of observations in each category
Two way Contingency Tables • Analysis of contingency tables is done correctly only on the raw counts, not on the percentages, proportions, or relative frequencies of the data
Wildebeest carcasses from the Serengeti (Sinclair and Arcese 1995)
Sex, cause of death, and bone marrow type • Sex (males / females) • Cause of death (predation / other) • Bone marrow type: • Solid white fatty (healthy animal) • Opaque gelatinous • Translucent gelatinous
Contingency table Sex * Death Crosstabulation
Contingency table Sex * Marrow Crosstabulation
Contingency table Death * Marrow Crosstabulation
Are the variables independent? We want to know, for example, whether males are more likely to die by predation than females • Specifying the null hypothesis: • The predictor and response variable are not associated with each other. The two variables are independent of each other and the observed degree of association is not stronger than we would expect by chance or random sampling
Calculating the expected values • The expected value is the total number of observations (N) times the probability of a population being both males and dead by predation
The probability of two independent events Because we have no other information than the data, we estimate the probabilities of each of the right hand terms from the equation from the marginal totals
Contingency table Sex * Death expected values
Testing the hypothesis: Pearson’s Chi-square test = 0.0866, P=0.7685 = 0.0253, P=0.8736
Calculating the P-value • We find the probability of obtaining a value of Χ2 as large or larger than 0.0866 relative to a Χ2 distribution with 1 degree of freedom • P = 0.769
An alternative • The likelihood ratio test: It compares observed values with the distribution of expected values based on the multinomial probability distribution = 0.0866
Two way contingency tables • Sex * Death Crosstabulation: • Sex * Marrow Crosstabulation: • Marrow * Death Crosstabulation:
Log-linear models • They treat the cell frequencies as counts distributed as a Poisson random variable • The expected cell frequencies are modeled against the variables using the log-link and Poisson error term • They are fit and parameters estimated using maximum likelihood techniques
Log-linear models • Do not distinguish response and predictor variables: all the variables are considered equally as response variables
However • A logit model with categorical variables can be analyzed as a log-linear model
Two way tables • For a two way table (I by J) we can fit two log-linear models • The first is a saturated (full) model • Log fij= constant + λix+ λky+ λjkxy • fij= is the expected frequency in cell ij • λix = is the effect of category i of variable X • λky = is the effect of category k of variable Y • λjkxy = is the effect any interaction between X and Y • This model fit the observed frequencies perfectly
Note • The effect does not imply any causality, just the influence of a variable or interaction between variables on the log of the expected number of observations in a cell
Two way tables • The second log-linear model represents independence of the two variables (X and Y) and is a reduced model: • Log fij= constant + λix+ λky • The interpretation of this model is that the log of the expected frequency in any cell is a function of the mean of the log of all the expected frequencies plus the effect of variable x and the effect of variable y. This is an additive linear model with no interactions between the two variables
Interpretation • The parameters of the log-linear models are the effects of a particular category of each variable on the expected frequencies: • i.e. a larger λ means that the expected frequencies will be larger for that variable. • These variables are also deviations from the mean of all expected frequencies
Null hypothesis of independence • The Ho is that the sampling or experimental units come from a population of units in which the two variables (rows and columns) are independent of each other in terms of the cell frequencies • It is also a test that λjkxy =0: • There is NO interaction between two variables
Test • We can test this Ho by comparing the fit of the model without this term to the saturated model that includes this term • We determine the fit of each model by calculating the expected frequencies under each model, comparing the observed and expected frequencies and calculating the log-likelihood of each model
Test • We then compare the fit of the two models with the likelihood ratio test statistic ∆ • However the sampling distribution of this ratio (∆ ) is not well known, so instead we calculate G2 statistic • G2 =-2log∆ • G2 Follows a Χ2distribution for reasonable sample sizes and can be generalized to • =- 2(log-likelihood reduced model -- log-likelihood full model)
Degrees of freedom • The calculated G2 is compared to a Χ2distribution with (I-1)(J-1) df. • This df (I-1)(J-1) is the difference between the df for the full model (IJ-1) and the df for the reduced model [(I-1)+(j-1)]
Akaike information criteria Hirotugu Akaike
Three way interaction • Death*Sex*Marrow • Models compared 8 vs 9 • G2= 7.19 • df 2 • P=0.027
Conditional independence Death and marrow have a partial association
Complete independence • Models compared 1 vs 8 • G2=35.57 • df= 5 • P=<0.001
Warning • Always fit a saturated model first, containing all the variables of interest and all the interactions involving the (potential) nuisance variables. Only delete from the model the interactions that involve the variables of interest.