Download
1 / 25
250 likes | 427 Views
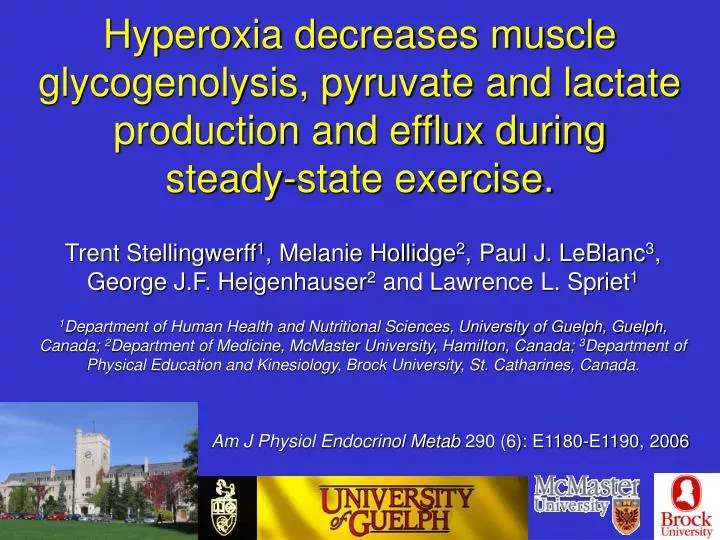
Hyperoxia decreases muscle glycogenolysis, pyruvate and lactate production and efflux during steady-state exercise. Trent Stellingwerff 1 , Melanie Hollidge 2 , Paul J. LeBlanc 3 , George J.F. Heigenhauser 2 and Lawrence L. Spriet 1

E N D
Hyperoxia decreases muscle glycogenolysis, pyruvate and lactate production and efflux during steady-state exercise. Trent Stellingwerff1, Melanie Hollidge2, Paul J. LeBlanc3, George J.F. Heigenhauser2 and Lawrence L. Spriet1 1Department of Human Health and Nutritional Sciences, University of Guelph, Guelph, Canada; 2Department of Medicine, McMaster University, Hamilton, Canada; 3Department of Physical Education and Kinesiology, Brock University, St. Catharines, Canada. Am J Physiol Endocrinol Metab 290 (6): E1180-E1190, 2006
Effects of hyperoxia during steady-state exercise • Numerous studies have reported decreases in blood lactate and decreases in RER during hyperoxia, suggesting that muscle metabolism is altered during aerobic exercise by decreasing reliance on CHO and promoting fat oxidation. • (Welch RG, review, 1987) • However, exercise measurements of whole-body O2 uptake during hyperoxia are technically difficult and can lead to overestimates of VO2 and artificially low RER. (Welch RG, review, 1987) • •Total paucity of muscle measurements involving steady-state • exercise (>5min) and hyperoxia: • - Graham et al. showed decrease muscle lactate and no change • in glycogen utilization over 40 min of cycling exercise • (Graham et al. J Appl Physiol 63 (4): 1457-1462, 1987).
Major findings of previous hyperoxia study Stellingwerff et al.J Appl Physiol 98: 250-256, 2005 • Conversely, we found that hyperoxic breathing reduced the breakdown of glycogen over 15 min of steady-date cycling. • There was no effect of hyperoxia on carbohydrate oxidation (as estimated from PDH activation) as compared to normoxia. • Few studies have examined effects of hyperoxia using arterial and venous (a-v) blood sampling. But, primary findings are that hyperoxia has no effect on lactate efflux, suggesting lactate production is decreased (Knight et al. J Appl Physiol 81: 246-251, 1996; Mourtzakis et al.J Appl Physiol 97: 1796-1802, 2004; Pedersen et al. Acta Physiol Scand 166: 309-318, 2004). •The mechanism(s) responsible for the decrease in muscle glycogenolysis and blood lactate during hyperoxia are still not clear.
Purpose Through the use of a-v line and blood flow methodology, coupled with muscle biopsy sampling, this study had 2 primary aims: I. To determine if the decreased muscle and blood lactate that is normally found with hyperoxic vs.normoxic breathing is due to: 1) a decreased glycogenolysis leading to decreased muscle pyruvate and lactate production AND/OR 2) decreased pyruvate and lactate efflux. II. To elucidate the mechanisms behind the decreased glycogenolysis and decreased blood lactate.
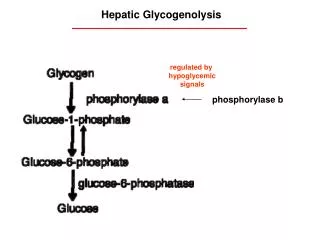
We accomplished this by measuring glycogenolysis and the 5 major fates of pyruvate: Glycogen Glucose G-6-P Pyruvate PDH 2 Pyruvate1 Pyruvate5 Efflux Aceytl-CoA Lactate4 Lactate3 Efflux During 40 min of cycling at 70% VO2peak while subjects breathed either 21 or 60% O2.
Hypothesis We hypothesized that hyperoxia would: • I. Confirm our previous findings of a decreased muscle glycogenolysis, and no change in pyruvate oxidation via PDH. • II. Which would result in decreased muscle pyruvate and lactate production, III. Leading to decreased muscle pyruvate and lactate release. • Mechanisms would be mediated through attenuated • accumulations of ADPf and AMPf and epinephrine during exercise.
7 active males Age: 22.3 1.2 yr, Weight: 76.1 4.3 kg, and VO2peak: 52.8 3.0 ml · kg-1 · min-1 RESTING EXERCISE 20min of resting breathing at 40min of cycling at 70% VO2max with continued either 21% or 60% inspired O2 21% or 60% inspired O2 Exercise and Sampling Protocol BLD#1 BLD#2 BLD#3 BLD#4 BLD#5 BLD#6 BLD#7 -20min -10min 0min 5min 10min 20min 30min 40min BIO#1 BIO#2 BIO#3 BIO#4 Muscle Biopsy Sample a-v difference blood draws with blood flow measurements (avg. of 3 per time point)
No change in leg O2 delivery (CaO2 x leg blood flow) ~8% dec. ~7% increase in CaO2 with hyperoxia (21.1 ± 0.9 vs. 19.6 ± 0.9 ml/dl)
Pyruvate Efflux PDHa Flux Lactate Efflux Lactate Accum. Note: Pyruvate Accum. (negligible) † Decreased total pyruvate production during hyperoxia † 900 870.1 4.6% 69.4% 21.8% 4.2% 750 734.8 4.0% 82.4% 10.0% 3.6% 600 Total pyruvate production over 40 min (mmoles) 450 300 150 0 21% 60%
High Energy Phosphates • Increased oxidative phosphorylation potential during hyperoxia • - PCr utilization • ADPf accumulation • AMPf accumulation Suggests decreased energy supply by substrate level phosphorylation
62% 27% 56% 15% 16% Overview of skeletal muscle regulation during hyperoxia Hyperoxia resulted in “tighter” metabolic control between glycogenolysis and CHO oxid. (PDHa)- Similar to that found following even short-term endurance training hyperoxia vs. normoxia (mmol/min/leg) Glycogen = Glucose G-6-P Pyruvate = PDH 2 Pyruvate1 Pyruvate5 Production Efflux Aceytl-CoA Lactate4 Lactate3 Production Efflux
Lactate Epi ATP ADP Cr PCr + + ATP ADP + ATP ADP ? NC (O2 delivery) (PiO2) ? Glycogen blood Glycogenolysis G-6-P G-1-P PM cytosol FFA-FABP Pyruvate Lactate NC CPT-I OM PDH CAT NC IM CPT-1I b-oxidation matrix acetyl-CoA fatty acyl-CoA TCA Cycle Oxidative ATP Provision NADH O2 ADP + Pi
LABMATES at Guelph ACKNOWLEDGEMENTS Advisor: Lawrence Spriet Veronic Bezaire Rebecca Tunstall Kerry Mullen Katie Junkin Jason Talanian Jane Rutherford Graham Holloway Clinton Bruce Chris Perry Brianne Thrush Angela Smith
ACKNOWLEDGEMENTS LABMATES in Maastricht Advisor: Luc van Loon Milou Beelen, Hanneke Boon, Richard Jonkers, Rene Koopman, Ralph Manders, Bart Pennings, Joan Senden, Kristof Vanschoonbeek, Lex Verdijk, Antoine Zornec
Hyperoxia Study II: Overall Study Outline 100% O2 from wall BIOPSIES Mixer (Delivers 21 or 60% O2 to the subject) 21% O2 OR 60% O2 Subject on Bike Arterial Sampling 500 L Tissot (Mixed O2 Storage Vesicle) Venous Sampling BLOOD Inspired O2 Blood Flow Measurments (avg of 3, via thermodilution)
+ Regulation of Oxidative Phosphorylation 3 ADP + 3 Pi + NADH + ½ O2 + H+ → 3 ATP + NAD+ + H2O ATP ADP Cr PCr FFA-FABP cytosol ATP ADP Pyruvate Lactate CPT-I OM PDH CAT IM CPT-1I ATP ADP TCA cycle matrix b-oxidation acetyl-CoA fatty acyl-CoA Oxidative ATP Provision NADH O2 ADP + Pi (DF Wilson)
1. PCr utilization in the creatine kinase reaction: PCr + ADP + H+ ATP + Cr 2. and the metabolism of glycogen with lactate formation: Glycogen + 3 ADP + 3 Pi → 3 ATP + 2 lactate + 2 H+ Regulation of Substrate Phosphorylation During exercise situations with increasing intensity, when ATP production from oxidative phosphorylation cannot match the rate of ATP hydrolysis, the shortfall in oxidative energy supply is made up by substrate phosphorylation
Lactate FFA-ALB Glucose blood PM cytosol Glucose Glycogen HK PHOS LIPASE TG FFA-FABP G-6-P G-1-P PFK ATP ADP NAD fatty acyl-CoA ATP Cr PCr NADH NAD NADH ATP ADP Pyruvate Lactate LDH CPT-I OM CAT PDH IM CPT-1I ATP ADP NAD NADH matrix b-oxidation H+ acetyl-CoA fatty acyl-CoA NAD NAD NADH TCA cycle E T C CO2 NADH H+ H+ O2 H20