Download
1 / 21
210 likes | 640 Views
Google Maps Representation of Geo-scientific Data Team Members Jing Huang Samar Bajaj Neha Majithia Sudeep Singla Team Advisor Rami Al Ghanmi Outline Introduction Need for mapping API Midterm Deliverables The Mapping API Sample Data Breakdown of Tasks Final Deliverables

E N D
Team Members • Jing Huang • Samar Bajaj • Neha Majithia • Sudeep Singla • Team Advisor Rami Al Ghanmi
Outline • Introduction • Need for mapping API • Midterm Deliverables • The Mapping API • Sample Data • Breakdown of Tasks • Final Deliverables
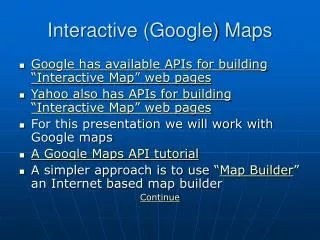
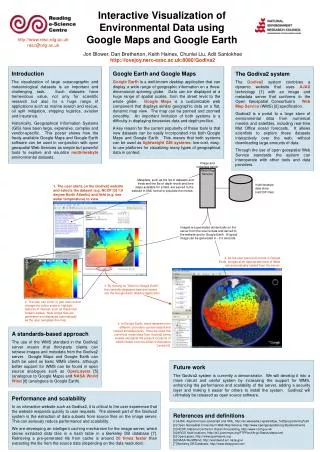
Introduction • Aim of the project is to develop anAPI between GoogleMaps and a database of Geo-scientific data. • Enable scientists to visualize the content of the database on an online mapping system. • Java-based system generates Keyhole Markup Language (KML) versions of the database content to facilitate use of GoogleMaps and GoogleEarth. • Also develop a web service that accepts requests and plots results on the requested map.
Sample Fault Data California Region Los Angeles Region public-domain fault data, California's fault system
Why do we need an interface betweenGoogleMaps and Geo-scientific data? • Convenient representation of fault data for ease in identifying fault areas in particular locations. • Representation of co-ordinates as markers and fault zones and data related to the fault in a graphical way. • Ease in locating fault areas and querying the earthquake fault database. • Can be used for live GPS feed and current information on fault stability. • Could be used for prompt response to earthquakes and fault locating in inhabited areas.
Midterm Deliverables • GoogleMaps demo • The demo includes a small set of faults and data related to them. • The data for the Midterm is not pulled from a database but it is accessed statically. • Rough design for the API
Diagrammatic Representation API Generates a KML file Query the DB for Fault co-ordinates KML File Java API Access the DB via JDBC GoogleMaps API Earthquake Fault Database Fault locations and meta data shows up on the map
The Mapping API • The API provides the user to represent geo-scientific information on GoogleMaps and GoogleEarth. • This project concentrates on Fault information, but other information like GPS, InSAR will be representable. • The user will use one of the 3 interfaces • JDBC • Web Service • Command Line Interface
The back-end supporting all these interfaces will be the same. • The outcome of this API is a set of faults and/or points of interest displayed as lines (or a connection of line segments) on a GoogleMaps/ GoogleEarth map. • The API provides the features of including metadata about the fault, links to live GPS readings, current information regarding the stability of the fault. • The entire API is developed in Java.
Sample Fault Data California Region Los Angeles Region public-domain fault data, California's fault system
Sample KML file for displaying markers on GoogleMaps <?xml version="1.0" encoding="UTF-8"?> <kml xmlns="http://earth.google.com/kml/2.0"> <Document> <name>KML Example file</name> <description>Simple markers</description> <Placemark> <name>Marker 1</name> <description>Some stuff to put in the first info window</description> <Point> <coordinates>-122.1,37.4,0</coordinates> </Point> </Placemark> <Placemark> <name>Marker 2</name> <description>Some stuff to put in the second info window</description> <Point> <coordinates>-122.0,37.4,0</coordinates> </Point> </Placemark> </Document> </kml>
Fault Data Represented in Google map http://www-scf.usc.edu/~jinghuan/googleMap.htm
Breakdown of Tasks • Java API/ JDBC The Java API with the help of JDBC will be used to query the Earthquake fault database for the co-ordinates of the faults. It also generates the KML file for representation of data. • KML/ GoogleMap Interfacing Once the KML file is generated by the Java API the KML file interfaces with GoogleMaps/ GoogleEarth to display the fault locations and zones and fault data. • Web Service and CLI The interoperability of the Web services and CLI with the KML file will allow the user to use any of the 3 interfaces.
Final Deliverables • The Java API The API will work with the database to pull data and generate a KML file. • Web services client and server configuration. The client will be able to use web services to run the queries. • The final interoperable working interface. The client will be able to use either 3 interfaces, get data from the database and see the displayed fault lines/ zones and related data on the fault on GoogleMaps/ GoogleEarth. • Tutorial on how to deploy and run the code.
References • William J. Cromie, New Earthquake Fault Discovered Under Los Angeles; HARVARD GAZETTEARCHIVES • Southern California Earthquake data Center; http://www.scecdc.scec.org/index.html • http://earth.google.com/kml/index.html • http://code.google.com/apis/kml/documentation/kml_tut.html