Download
1 / 26
270 likes | 393 Views
Process Modeling. Chapter 6. Key Definitions. A process model is a formal way of representing how a business operates Data flow diagramming shows business processes and the data that flows between them. Key Definitions.

E N D
Process Modeling Chapter 6
Key Definitions • A process model is a formal way of representing how a business operates • Data flow diagramming shows business processes and the data that flows between them
Key Definitions • Logical process models describe processes without suggesting how they are conducted • Physical models include information about how the processes are implemented
Structured English Common Statements Example Action Statement Profits = Revenues - Expenses Generate Inventory - Report Add Product record to Product Data Store If Statement IF Customer Not in Customer Data Store THEN Add Customer record to Customer Data Store ELSE Add Current-Sale to Customer’s Total-Sales Update Customer record in Customer Data Store For Statement FOR all Customers in Customer Data Store Generate a new line in the Customer-Report Add Customer’s Total-Sales to Report-Total Case Statement CASE If Income < 10,000: Marginal-tax-rate = 10% If Income < 20,000: Marginal-tax-rate = 20% If Income < 30,000: Marginal-tax-rate = 31% If Income < 40,000: Marginal-tax-rate = 35% ELSE Marginal-tax-rate = 38% ENDCASE
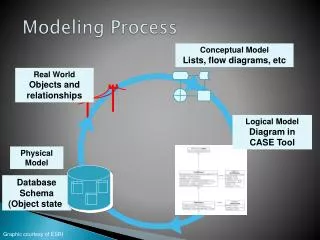
Decomposition is the process of modeling the system and its components in increasing levels of detail. Balancing involves insuring that information presented at one level of a DFD is accurately represented in the next level DFD. Key Definition
Shows the context into which the business process fits Shows the overall business process as just one process Shows all the outside entities that receive information from or contribute information to the system Context Diagram
Shows all the processes that comprise the overall system Shows how information moves from and to each process Adds data stores Level 0 Diagram
Shows all the processes that comprise a single process on the level 0 diagram Shows how information moves from and to each of these processes Shows in more detail the content of higher level process Level 1 diagrams may not be needed for all level 0 processes Level 1 Diagrams
Shows all processes that comprise a single process on the level 1 diagram Shows how information moves from and to each of these processes Level 2 diagrams may not be needed for all level 1 processes Correctly numbering each process helps the user understand where the process fits into the overall system Level 2 Diagrams
A data flow split shows where a flow is broken into its component parts for use in separate processes Data flow splits need not be mutually exclusive nor use all the data from the parent flow As we move to lower levels we become more precise about the data flows A data flow join shows where components are merged to describe a more comprehensive flow Data Flow Splits and Joins
Where a process can produce different data given different conditions We show both data flows and use the process description to explain why they are alternatives Tip -- alternative data flows often accompany processes with IF statements Alternative Data Flows
Your Turn • At this point in the process it is easy to lose track of the “big picture”. • Describe the difference between data flows, data stores, and processes. • Describe in your own words the relationship between the DFD and the ultimate new application being developed.
Elements of a Use Case • Trigger -- event that causes the scenario to begin • External trigger • Temporal trigger • All possible inputs and outputs • Individual steps • Show sequential order • Show conditional steps
Integrating Scenario Descriptions • DFDs generally integrate scenario descriptions • Names of use cases become processes • Names of inputs and outputs become data flows • Combining “small” data inputs and outputs into a single flow
Steps in Building DFDs • Build the context diagram • Create DFD fragments for each scenario • Organize DFD fragments into level 0 • Decompose level 0 DFDs as needed • Validate DFDs with user
DFD Fragment Tips • All process names must be verb phrases • Maintain organization’s viewpoint in naming processes • Layouts often place • processes in the center • inputs from the left • outputs to the right • stores beneath the processes
Level 0 Tips • Generally move from top to bottom, left to right • Minimize crossed lines • Iterate as needed • The DFD is often drawn many times before it is finished, even with very experienced systems analysts
Tips for Level 1 and Below • Sources for inputs and outputs listed at higher level • List source and destination of data flows to processes and stores within each DFD • Depth of DFD depends on overall system complexity • Two processes generally don’t need lower level • More than seven processes become overly complex and difficult to read
Validating the DFD • Syntax errors • Assure correct DFD structure • Semantics errors • Assure accuracy of DFD relative to actual/desired business processes • User walkthroughs • Role-play processes • Examine lowest level DFDs • Examine names carefully
Summary • The Data Flow Diagram (DFD) is an essential tool for creating formal descriptions of business processes and data flows. • Use cases record the input, transformation, and output of business processes. • Eliciting scenario descriptions and modeling business processes are critically important skills for the systems analyst to master.