Download

1 / 33
330 likes | 541 Views
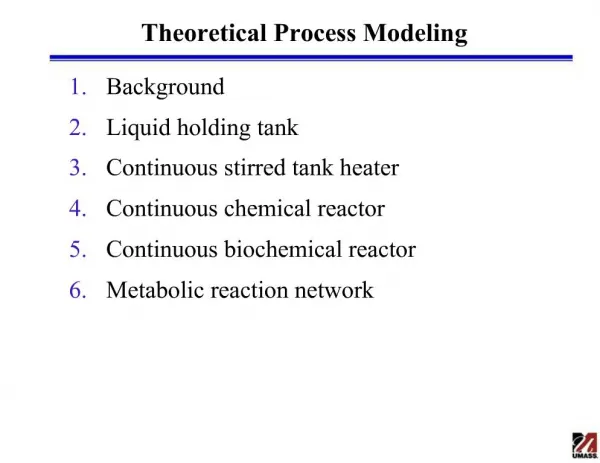
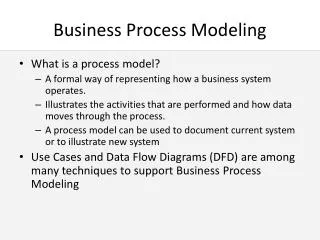
Process Modeling. Chetankumar Patel. Outline. Process decomposition diagrams Data flow diagram (DFD). Process Model. A process is a business activity which when executed produces certain outputs from given inputs

E N D
Process Modeling Chetankumar Patel
Outline • Process decomposition diagrams • Data flow diagram (DFD)
Process Model • A process is a business activity which when executed produces certain outputs from given inputs • The function(s) performed by a process may be complex, with multiple inputs, outputs and users • The entire application itself is a process • We use successive decomposition into sub processes to reveal greater details of the processing
Function Decomposition • Decomposition splits wok of a task into subtasks; subtasks together make-up the parent task; not like ‘calling’ a module • Balanced decomposition: sub-tasks are roughly equal in complexity
Function Decomposition … • Top-down decomposition gives hierarchical structure • Decompose into 2 or more; not more than 5 • A high cohesion (high independence) and minimum coupling (minimum interdependence) are fundamental criteria • Continue decomposition until elementary processes are identified
Function Decomposition • Elementary process is a smallest unit of activity meaningful to end user (it sees and leaves data in consistent state) • Process decomposition diagram • A tree structure • Elementary processes are leaf nodes • Data are not shown
Exercise: prepare FDDs for • Railway reservation system • Hospital patient management • Employee payroll
Function Decomposition … • Use proper naming of processes • Business functions named as nouns (marketing, Inventory control, …) • Process name consists of an active verb and an object (accept order, calculate interest, …)
Naming … • Avoid long names (sentences containing and, if, then, etc. indicate non-cohesive complex tasks) • Real world is a good reference for selecting proper names; organizational units are organized functionally and each unit has a well-defined task
Data Flow Diagram (DFD) • Very popular tool for describing functions of a system in terms of processes and data used by them • FDD may be done before DFD or we may prepare DFDs directly • Have more contents than FDDs • Flow of data is shown, not flow of control • DFDs are simple pictorial representations; easily understood by users and management.
Data Flow Diagrams (DFD) … • DFDs are unambiguous and concise • They can describe processing at physical as well as logical levels • DFDs facilitate top-down development • They permit outlining of preferences and scope
or or DFD Notation • Data Flow : labeled arrow • Sources and sinks of information/data (also called external entity) • Process n n or (n : number for referencing • Available data (data store) n
Context Diagram • Shows the entire application as a single process • Identifies its external interfaces • This is the starting point; also called Fundamental System Model, Level 0 DFD
Process Refinement • Decompose a process into sub processes • May reveal more data stores, external interfaces • Use decimal numbering system: process 1 is decomposed into 1.1, 1.2, etc. • At each level, understand all data flows and processing; label processes, data stores and data flows (arrows) meaningfully. • Continue decomposition and stop when control flow (conditional branches, loops) surfaces. Refine until processes are well understood.
Refinement … • DFDs do not show control flow • DFDs do not show initializations (such as initial file creation), but show processes running in a steady state • DFDs only show exceptions/errors having specific business rules to deal with them; handling of routine errors generally not shown
Refinement … • Processes must be independent of each other (cohesion, coupling principles apply); work of a process depends only on its inputs and not on state of another process • Only needed data should be input, and outputs should be based on data entering the process
Refinement … • Ensure consistency among levels: inputs and outputs at previous level should be present at next level
Physical DFD • Shows implementation details • Names and locations of places/people • Ways of storing data (like card indexes) • Tasks as performed today: e.g., 2 persons handling UG, PG students separately. • Useful for describing existing system to validate it with users • Needs to be converted into logical DFD after validation from users
DFD Example 2: Old Car Mart • Buys and sells old cars; has large number in stock: different models, make, year,colors,… • Does some repairs for adding value; records kept; has own garage • Advertise in news papers • Salesmen hired on commission basis to handle customers, negotiate, etc. • Needs to take stocks; prepare summary of sales, profits, etc; pay salesmen Prepare DFD and ER diagrams
Car Mart … • Define data stores and flow clearly to understand the DFD • We can further refine some of the processes • For process 5: Making a sale • Take buyer requirements and his/her other details • List cars that match requirements • Show repair history, car history • Register sale and negotiated price • Compute commission
E-R Diagram Add important attributes, give cardinalities
Example 3: Book Supplier • Supplies books to customers; no stocks maintained; books sourced directly from publishers • Prepare context diagrams (all inputs/output not shown, such as invoices,…..
Book Supplier : homework • Refinement 1 needs to be extended for handling payments • Extend for : Payments from customers • Create ‘a/c receivable’ for books sent • Update receivable when payments received • Credit rating will need to be adjusted periodically • Extend for : Payments to publishers • Create ‘a/c payable’ when invoices received • Check invoices with books actually received • Make payments periodically as per payment terms (within fixed days; incentives for early payment, etc.)
Summary • Process modeling by process decomposition • DFD shows data flows, stores and processes, but not control flows • Proper naming of stores, processes and indicating data flowing among them very important for DFDs to be independently readable