Download
1 / 23
230 likes | 347 Views
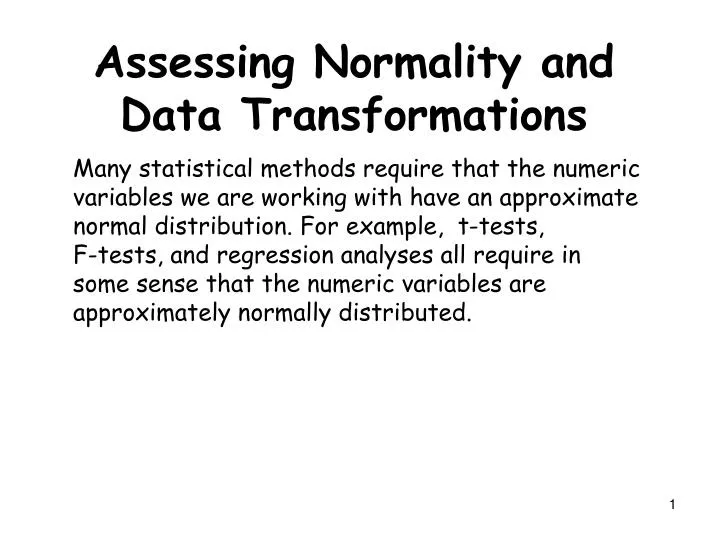
Many statistical methods require that the numeric variables we are working with have an approximate normal distribution. For example, t-tests, F-tests, and regression analyses all require in some sense that the numeric variables are approximately normally distributed.

E N D
Many statistical methods require that the numeric variables we are working with have an approximate normal distribution. For example, t-tests, F-tests, and regression analyses all require in some sense that the numeric variables are approximately normally distributed. Assessing Normality and Data Transformations
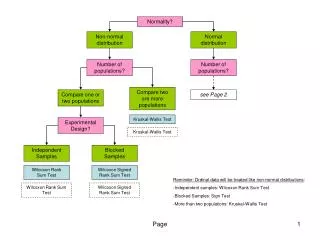
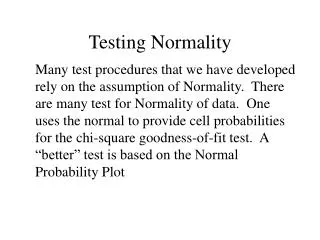
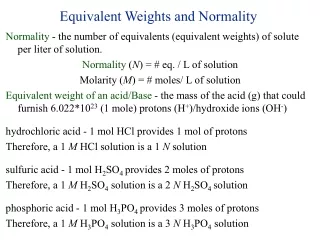
Assessing Normality and Data Transformations Tools for Assessing Normality include Histogram and Boxplot Normal Quantile Plot (also called Normal Probability Plot) Goodness of Fit Tests such as Anderson-Darling Test Kolmogorov-Smirnov Test Lillefor’s Test Shapiro-Wilk Test Problem: they don’t always agree! 2
Assessing Normality and Data Transformations The following examples are intended to illustrate what normal data really looks like. In each case you could produce conventional descriptive statistics, a histogram with a superimposed normal curve, and a normal scores plot also called a normal probability plot. 3
Assessing Normality and Data Transformations Analyze > Descriptive Statistics > Explore Under plots select histogram, descriptive statistics and boxplots are default options plus a Kolmogorov-Smirnov statistic Analyze > Descriptive Statistics > P-P plot Produces a probability plot Graphs > Legacy Dialogs > Histogram Tick – display normal curve Graphs > Legacy Dialogs > Line Select Simple and Groups of Cases the use Define to choose the variable and select “cum %” If you wish to superimpose a normal curve, it is probably simpler in Excel! 4
Assessing Normality and Data Transformations If the data is “normal” the non-linear vertical axis in a probability plot should result in an approximately linear scatter plot representing the raw data. 5
Assessing Normality and Data Transformations The ideal plot is exhibited by the Chest Sizes Of Militiamen (see printed notes for fuller details). Here is an example where the data is perfectly normal. The P-P plot is a normal probability plot with the data on the horizontal axis and the expected z-scores if our data was normal on the vertical axis. When our data is approximately normal the spacing of the two will agree resulting in a plot with observations lying on the reference line in the normal probability plot. 6
Assessing Normality and Data Transformations When the data is plotted vs. the expected z-scores the normal probability plot shows right skewness by a downward bending curve, see Distribution Patterns (QRAT, see printed notes for more details). 8
Assessing Normality and Data Transformations When the data is plotted vs. the expected z-scores the normal probability plot shows left skewness by an upward bending curve, see Estimating the Speed of Light, see printed notes for more details). 10
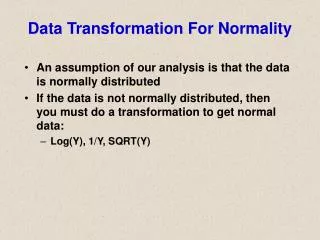
Transformations to Improve Normality (removing skewness) Many statistical methods require that the numeric variables you are working with have an approximately normal distribution. Reality is that this is often times not the case. One of the most common departures from normality is skewness, in particular, right skewness. 12
Tukey’s Ladder of Powers Tukey (1977) describes an orderly way of re-expressing variables using a power transformation. If a transformation for x of the type xλ, results in an effectively linear probability plot, then we should consider changing our measurement scale for the rest of the statistical analysis. There is no constraint on values of λ that we may consider. Obviously choosing λ = 1 leaves the data unchanged. Negative values of λ are also reasonable. Tukey (1977) suggests that it is convenient to simply define the transformation when λ = 0 to be the logarithmic function rather than the constant 1. 13
Tukey’s Ladder of Powers A typical ladder is Sometimes and are also included. We go up the ladder (positive λ) to remove left skewness and down the ladder (negative λ) to remove right skewness. Tukey, J. W. (1977) Exploratory Data Analysis. Addison-Wesley, Reading, MA. 14
Tukey’s Ladder of Powers In general if the normal distribution fits the data, then the plotted points will roughly form a straight line. In addition the plotted points will fall close to the fitted line. Also the Anderson-Darling statistic will be small, and the associated p-value will be larger than the chosen α-level (usually 0.05). So the test rejects the hypothesis of normality when the p-value is less than or equal to α. 17
Tukey’s Ladder of Powers In general if the normal distribution fits the data, then the plotted points will roughly form a straight line. In addition the plotted points will fall close to the fitted line. Also the Anderson-Darling statistic will be small, and the associated p-value will be larger than the chosen α-level (usually 0.05). So the test rejects the hypothesis of normality when the p-value is less than or equal to α. 18
Tukey’s Ladder of Powers To test for normality is SPSS you can perform a Kolmogorov-Smirnov Test, Analyze > Nonparametric tests > Legacty Dialogs > 1-Sample Kolmogorov-Smirnov Test The Asymp. Sig. (2 tailed) value is also known as the p-value. This tells you the probability of getting the results if the null hypothesis were actually true (i.e. it is the probability you would be in error if you rejected the null hypothesis). 19
Tukey’s Ladder of Powers To test for normality is SPSS you can perform a Kolmogorov-Smirnov Test, Analyze > Nonparametric tests > 1-Sample Kolmogorov-Smirnov Test The Asymp. Sig. (2 tailed) value is also known as the p-value. This tells you the probability of getting the results if the null hypothesis were actually true (i.e. it is the probability you would be in error if you rejected the null hypothesis). 20
Tukey’s Ladder of Powers The hypothesis are H0 the distribution of x is normal H1 the distribution of x is not normal If the p-value is less than .05, you reject the normality assumption, and if the p-value is greater than .05, there is insufficient evidence to suggest the distribution is not normal (meaning that you can proceed with the assumption of normality.) In summary if the test is significant (lower than or equal to 0.05) implies the data is not normally distributed. 21
Does It Really Matter? “Students t test and more generally the ANOVA F test are robust to non-normality” (Fayers 2011). However “Thus a clearer statement is that t tests and ANOVA are ‘robust against type-I errors’. This of course accords with the enthusiasm that many researchers have in obtaining ‘‘significant’’ p values. The aim of this article is to show that type-II errors can be substantially increased if non-normality is ignored.” (Fayers 2011). 22
Does It Really Matter? Alphas, betas and skewy distributions: two ways of getting the wrong answer Paper Peter Fayers Adv. Health Sci. Educ. Theory Pract. 2011 16(3) 291–296. Wilcox, R. R. (2005). Introduction to Robust Estimation and Hypothesis Testing (2nd ed.). Burlington MA: Elsevier Academic Press. ISBN 978-0-12-751542-7. Robustness to Non-Normality of Common Tests for the Many-Sample Location Problem Paper Khan A. and Rayner G.D. Journal Of Applied Mathematics And Decision Sciences, 2003, 7(4), 187:206 23