Download

1 / 11
130 likes | 385 Views
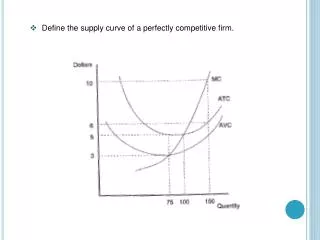
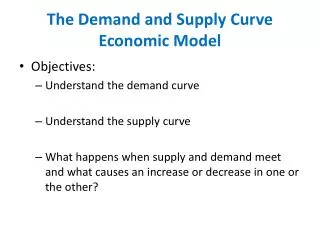
The Supply Curve. The Supply Curve Supply Schedule (Table) It works the same way the demand schedule shown It says the quantity sellers are willing to sell at different prices Supply Curve (Graph) A graphical representation of the supply schedule Law of supply

E N D
The Supply Curve • Supply Schedule (Table) • It works the same way the demand schedule shown • It says the quantity sellers are willing to sell at different prices • Supply Curve (Graph) • A graphical representation of the supply schedule • Law of supply • Higher prices leads to a higher quantity supplied • Higher the price, higher the supply; lower the price, lower the supply. • Supply curves normally slope upward
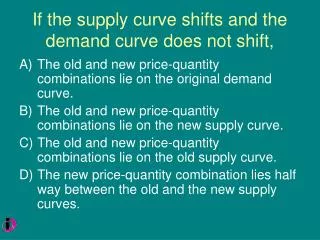
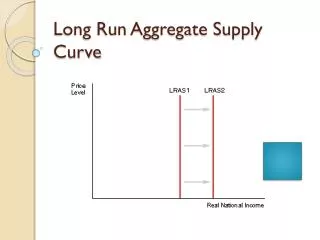
Shifts of the Supply Curve • A shift occurs when there is a change in supply (remember: shifts to the right is increase in supply, shifts to the left is decrease in supply)
Just like with the demand curve, there is a distinction between shift and movement • Movements along the supply curve are caused as a result from a change in price
5 Factors that Result in a Supply Shift 1.Changes in input prices • An input is anything used to produce a good or service • An input like output have prices • An increase in the price of the input makes production of the final good more costly for those who produce and sell it • So producers are less willing to supply the final good at any given price and supply curve shifts to the left • Similarly if the price on the input falls it makes the production of the final good less costly for the sellers • They are more willing to sell the good at any given price and supply curve shifts to the right
2.Changes in the Prices of Related Goods and Services • A single producer often produces a mix of goods rather than a single product • When a producer sells several products, the quantity of any one good it is willing to supply at any given price depends on the prices of its other co-produced goods
3. Changes in Technology • Economists determine technology to be all the methods people can use to turn inputs into useful goods and services. • When better technology becomes available, reducing the cost of production, supply increases and the supply curve shifts to the right
4. Changes in Expectations • When suppliers have some choice about when they put their good up for sale, changes in the expected future price of the good can lead a supplier to supply less or more of the good. • The choice the producer makes depends on a comparison of the current price versus the expected future price. • This illustrates how changes in expectations can alter supply • An increase in the anticipated future price of a good or service reduces supply • A fall in the anticipated future prices increases supply
5. Changes in the number of Producers • Individual supply curve • Shows the relationship between quantity supplied and price for an individual producers • Market supply curve • Shows how combined that quantity supplied by all individual producers in the market depends on the market price of that good • It is the horizontal sum of the individual supply curves of all producers • An increase in the number of producers leads to an increase in supply and a rightward shift to the supply curve.