Download
1 / 16
160 likes | 250 Views
Ch 8 – Competitive markets. The Market Supply Curve. The market supply curve is the sum of the marginal cost curves of all the firms. Whatever determines marginal cost also determines the competitive firm’s supply response. Entry and Exit.

E N D
Ch 8 – Competitive markets The Market Supply Curve • The market supply curve is the sum of the marginal cost curves of all the firms. • Whatever determines marginal cost also determines the competitive firm’s supply response.
Entry and Exit • Investment decisions shift the market supply curve to the right. • Investment decision - The decision to build, buy, or lease plant and equipment; to enter or exit an industry. • The profit motive drives these investment decisions. • If there are economic profits, more firms will enter the industry increasing market supply. • Each firm will respond to the resulting lower price and profits by reducing output.
Price Quantity Quantity Market Entry Market entry pushes price down and . . . Reduces profits of competitive firm S1 MC S2 ATC E1 f1 p1 p1 f1 p2 p2 E2 Market demand New firms enter q1 q2
Tendency Toward Zero Profits • An increase in market supply causes the economic profits to disappear. • Economic profits – The difference between total revenues and total economic costs. • When economic profits disappear, entry ceases and the market price stabilizes.
Low Barriers to Entry • Barriers to entry are obstacles that make it difficult or impossible for would-be producers to enter a particular market. • Barriers to entry may include: • Patents. • Control of essential factors of production. • Control of distribution outlets. • Well-established brand loyalty. • Government regulation.
A Shift of Market Supply • The entry of new firms shifts the market supply curve to the right. • New entrants will continue to enter as long as there are economic profits in short-run competitive equilibrium. Short-run equilibrium: p = MC
A Shift of Market Supply • As supply increases, price drops toward the minimum of ATC. • In long-run equilibrium, entry and exit cease, and zero economic profit (that is, normal profit) prevails. Long-run equilibrium: p = MC = minimum ATC
A Shift of Market Supply • Once established, long-run equilibrium will continue until market demand shifts or technological improvement reduces the cost of production.
$1000 $1000 800 800 Profits Price or Cost (per computer) Price (per computer) 0 20,000 0 500 600 Quantity (computers per month) Quantity (computers per month) The Competitive Price and Profit Squeeze An expanded market supply . . . Lowers price and profits for the typical firm MC S1 ATC S2 Old price G New price H m Market demand
$1000 $1000 800 800 Price or Cost (per computer) Price (per computer) 0 20,000 0 500 600 Quantity (computers per month) Quantity (computers per month) The Competitive Squeeze Approaching Its Limit The computer industry The typical firm MC ATC S2 S3 Old price J 700 620 New price K Profits m Market demand
Short-run equilibrium (p = MC) Long-run equilibrium (p = MC = ATC) MC MC ATC ATC pS pS Price or Cost Price or Cost pL qS qL Quantity Quantity Short- vs. Long-Run Equilibrium
Further Supply Shifts • With strong competition, often the only way for a firm to improve profitability is to reduce costs. • Cost reductions were accomplished through technological improvements, illustrated by a downward shift of the ATC and MC curves.
Price (per computer) Quantity (computers per month) Lower Costs Shifts the Supply Curve Downward Old MC New MC New ATC Old ATC N J $700 R 430 600
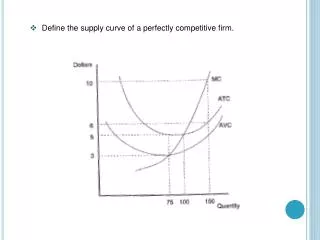
Shutdowns • Once a firm is no longer able to cover variable costs, it should shut down production. • Theshutdown point is the rate of output at which price equals minimum AVC.
Relentless Profit Squeeze • The sequence of events common to a competitive market situation includes the following: • High prices and profits signal consumers’ demand for more output. • Economic profit attracts new suppliers. • The market supply shifts to the right. • A new equilibrium is reached with increased quantities being produced and sold and the economic profit approaching zero. • In the long run, all economic profit is eliminated!