Download
1 / 37
370 likes | 472 Views
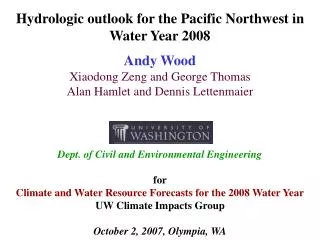
Hydrologic Outlook for the Pacific Northwest. Andy Wood and Dennis P. Lettenmaier Department of Civil and Environmental Engineering for Washington Water Outlook Workshop UW Climate Impacts Group March 21, 2005. Presentation Outline.

E N D
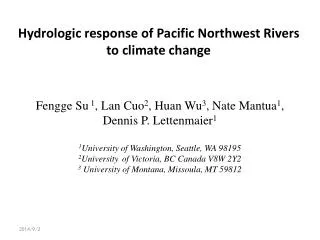
Hydrologic Outlook for the Pacific Northwest Andy Wood and Dennis P. Lettenmaier Department of Civil and Environmental Engineering for Washington Water Outlook Workshop UW Climate Impacts Group March 21, 2005
Presentation Outline 1. Introduction: UW Experimental Hydrologic Forecasting System 2. Water Year 2005 Assessment
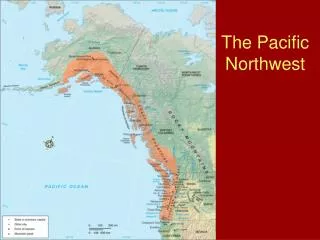
Introduction: Hydrologic prediction PNW Snow water content on April 1 SNOTEL Network McLean, D.A., 1948 Western Snow Conf. April to August runoff
Technical Advances related to Hydrologic Forecasting snow cats snow survey / graphical forecasts / index methods / i.e., regression computing in water resources SNOTEL network ESP method conceptual hydrologic models aerial snow surveys 1920s 1930s 1940s 1950s 1960s 1970s 1980s 1990s 2000s
recently observed meteorological data ensemble of met. data to generate forecast ESP forecast Spin-up ICs Forecast obs hydrologic state Introduction: Hydrologic prediction and ESP • NWS River Forecast Center (RFC) approach: • rainfall-runoff modeling • (i.e., NWS River Forecast System, • Anderson, 1973 • offspring of Stanford Watershed Model, Crawford & Linsley, 1966) • Ensemble Streamflow Prediction (ESP) • used for shorter lead predictions; • ~ used for longer lead predictions • Currently, some western RFCs and NRCS coordinate their seasonal forecasts, using mostly statistical methods.
Technical Advances related to Hydrologic Forecasting physical hydrologic models Internet / real-time data snow cats snow survey / graphical forecasts / index methods / i.e., regression satellite imagery computing in water resources SNOTEL network ENSO / seasonal climate forecasts ESP method conceptual hydrologic models aerial snow surveys desktop computing 1920s 1930s 1940s 1950s 1960s 1970s 1980s 1990s 2000s
Introduction: Experimental Hydrologic Forecasting Snowpack Initial Condition Soil Moisture Initial Condition
Introduction: Merging of SNOTEL obs with model SWE The pattern of observed SWE values, which are merged with the forecast initial conditions, was in good agreement with the VIC simulated snow state. The PNW currently has very low snowpack, while the Southwest and California have record high snowpacks.
Introduction: Experimental Hydrologic Forecasting streamflow forecast locations monthly hydrographs targeted statistics e.g., runoff volumes
Introduction: UW Experimental Hydrologic Forecasting Precip Temp SWE Runoff Soil Moisture Mar-05 Apr-05 May-05
Presentation Outline 1. Introduction: UW Experimental Hydrologic Forecasting System 2. Water Year 2005 Assessment
3/15 ESP fcst: Basin Average Water Balance The following series of results are for a March 15 ESP forecast, based on 1960-99 climate traces, compared with climatology forecast distribution max 0.75 median 0.25 min spinup
3/15 ESP fcst: WY2005 vs. WY1977 Precip, Temp WY1977 WY2005 How does the WY2005 current year compare to WY1977? Puget Sound Drainage Basin
3/15 ESP fcst: WY2005 vs. WY1977 SM, SWE WY1977 WY2005
3/15 ESP fcst: WY2005 vs. WY1977 Runoff Apr-Sep % of avg max 80 0.75 60 0.50 54 0.25 49 min 45 WY2005 Puget Sound Drainage Basin WY1977
3/15 ESP fcst: WY2005 vs. WY1977 Precip, Temp WY1977 WY2005 How does the WY2005 current year compare to WY1977? BC portion of Columbia R. Basin
3/15 ESP fcst: WY2005 vs. WY1977 SM, SWE WY1977 WY2005
3/15 ESP fcst: WY2005 vs. WY1977 Runoff Apr-Sep % of avg max 95 0.75 83 0.50 78 0.25 74 min 64 BC portion of Columbia R. Basin WY2005 WY1977
3/15 ESP fcst: WY2005 vs. WY1977 Precip, Temp WY1977 WY2005 How does the WY2005 current year compare to WY1977? Columbia R. basin upstream of The Dalles, OR
3/15 ESP fcst: WY2005 vs. WY1977 SM, SWE WY2005 WY1977
3/15 ESP fcst: WY2005 vs. WY1977 Runoff Apr-Sep % of avg max 88 0.75 73 0.50 69 0.25 65 min 55 Columbia R. basin upstream of The Dalles, OR WY2005 WY1977
Conclusions • Puget Sound regional runoff will be in the lowest quartile: 50% chance of between 49 - 60 % of normal • Columbia R. basin in slightly better shape, but still in lowest quartile: median runoff forecast is 69% of normal • Some other areas, such as the Yakima Basin, are drier than Puget Sound (39-46% of normal runoff) • This has been a rough year for forecasters!
Questions? website: www.hydro.washington.edu / Lettenmaier / Projects / fcst /
Introduction: Experimental Hydrologic Forecasting VIC model runoff is routed to streamflow gages, and verified against observations
Introduction:Seasonal Climate Prediction e.g., precipitation
3/15 ESP fcst: WY2005 vs. WY1977 Precip, Temp WY1977 WY2005 How does the WY2005 current year compare to WY1977? BC portion of Columbia R. Basin
3/15 ESP fcst: WY2005 vs. WY1977 SM, SWE WY1977 WY2005
3/15 ESP fcst: WY2005 vs. WY1977 Runoff Apr-Sep % of avg max 90 0.75 71 0.50 62 0.25 57 min 49 WY2005 Snake R. Basin WY1977
3/15 ESP fcst: WY2005 vs. WY1977 Precip, Temp WY1977 WY2005 How does the WY2005 current year compare to WY1977? Yakima R. Basin near Parker, WA
3/15 ESP fcst: WY2005 vs. WY1977 SM, SWE WY1977 WY2005
3/15 ESP fcst: WY2005 vs. WY1977 Runoff Apr-Sep % of avg max 61 0.75 46 0.50 41 0.25 39 min 31 WY2005 Yakima R. Basin near Parker, WA WY1977