Download
1 / 30
300 likes | 307 Views
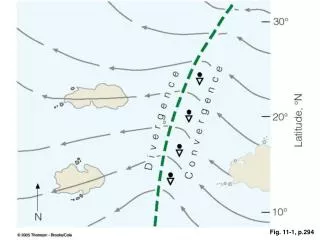
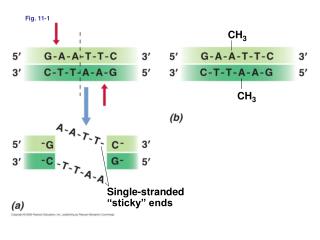
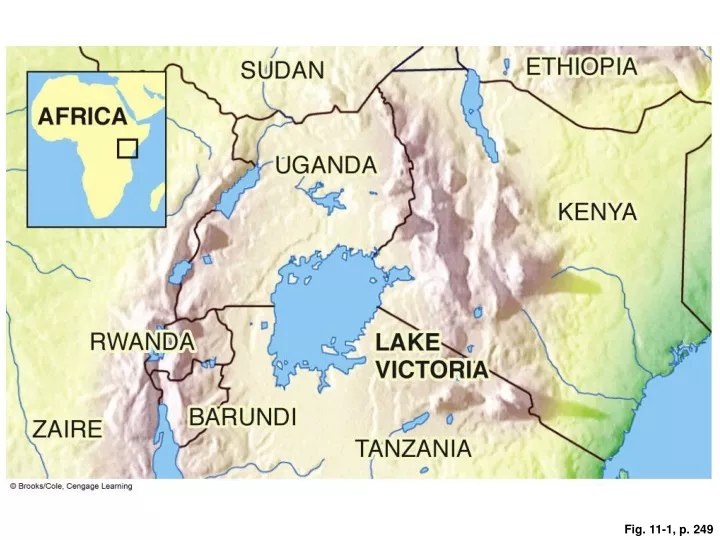
Fig. 11-1, p. 249. Fig. 11-2, p. 249. Fig. 11-3a, p. 251. Fig. 11-3b, p. 251. Fig. 11-4, p. 252. Fig. 11-A, p. 253. Fig. 11-5, p. 254. Fig. 11-6, p. 254. 900,000. 800,000. 700,000. 600,000. 500,000. Fish landings (tons). 400,000. 1992. 300,000. 200,000. 100,000. 0. 1900. 1920.

E N D
900,000 800,000 700,000 600,000 500,000 Fish landings (tons) 400,000 1992 300,000 200,000 100,000 0 1900 1920 1940 1960 1980 2000 Year Fig. 11-6, p. 254
Trawler fishing Fish farming in cage Spotter airplane Purse-seine fishing Sonar Drift-net fishing Long line fishing Float Buoy lines with hooks Deep sea aquaculture cage Fish caught by gills Fig. 11-7, p. 256
Trawler fishing Sonar Drift-net fishing Long line fishing Float Buoy lines with hooks Fish caught by gills Fish farming in cage Spotter airplane Purse-seine fishing Deep sea aquaculture cage Stepped Art Fig. 11-7, p. 256
Toothed whales Sperm whale with squid Killer whale Narwhal Bottlenose dolphin 0 2 4 6 8 10 12 14 16 18 20 22 24 26 28 30 Meters Fig. 11-8a, p. 258
Baleen whales Blue whale Fin whale Bowhead whale Right whale Sei whale Humpback whale Gray whale Minke whale 0 2 4 6 8 10 12 14 16 18 20 22 24 26 28 30 Meters Fig. 11-8b, p. 258
Baleen whales Toothed whales Sperm whale with squid Blue whale Killer whale Narwhal Fin whale Bottlenose dolphin Bowhead whale 0 2 4 6 8 10 12 14 16 18 20 22 24 26 28 30 Meters Right whale Sei whale Humpback whale Gray whale Minke whale 0 2 4 6 8 10 12 14 16 18 20 22 24 26 28 30 Meters Stepped Art Fig. 11-8a, p. 258
SOLUTIONS Managing Fisheries Fishery Regulations Bycatch Set catch limits well below the maximum sustainable yield Use wide-meshed nets to allow escape of smaller fish Use net escape devices for seabirds and sea turtles Improve monitoring and enforcement of regulations Ban throwing edible and marketable fish back into the sea Economic Approaches Sharply reduce or eliminate fishing subsidies Aquaculture Charge fees for harvesting fish and shellfish from publicly owned offshore waters Restrict coastal locations for fish farms Control pollution more strictly Protect Areas Depend more on herbivorous fish species Certify sustainable fisheries Establish no-fishing areas Nonnative Invasions Establish more marine protected areas Kill organisms in ship ballast water Rely more on integrated coastal management Filter organisms from ship ballast water Consumer Information Label sustainably harvested fish Dump ballast water far at sea and replace with deep- sea water Publicize overfished and threatened species Fig. 11-12, p. 265
70 60 Fishprint 50 40 30 Breeding pairs Biocapacity 20 10 0 1950 1955 1960 1965 1970 1975 1980 1985 1990 1995 2000 Year p. 274