Download
1 / 6
60 likes | 197 Views
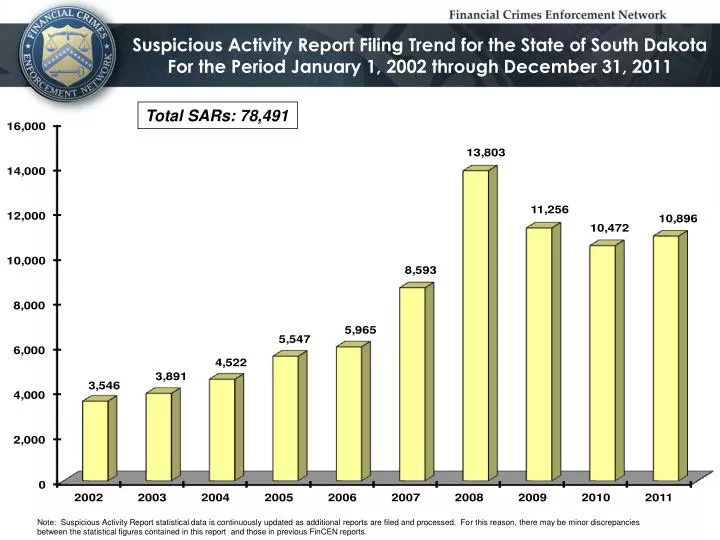
Suspicious Activity Report Filing Trend for the State of South Dakota For the Period January 1, 2002 through December 31, 2011. Total SARs: 78,491.

E N D
Suspicious Activity Report Filing Trend for the State of South Dakota For the Period January 1, 2002 through December 31, 2011 Total SARs: 78,491 Note: Suspicious Activity Report statistical data is continuously updated as additional reports are filed and processed. For this reason, there may be minor discrepancies between the statistical figures contained in this report and those in previous FinCEN reports.
Characterizations of Suspicious Activity For the State of South Dakota For the Period January 1, 2002 through December 31, 2011 Note: The pie chart represents the top nine characterizations plus additional characterizations in total. An individual SAR may cite more than one characterization. Hence, the number of characterizations detailed here significantly exceeds the total number of SARs.
SAR Filings by ZIP Code 500 to 6,960 (2) 100 to 499 (1) 30 to 99 (5) 10 to 29 (11) 0 to 9 (374) Suspicious Activity Report Geographic Pattern For the State of South Dakota For the Period January 1, 2010 through December 31, 2010 Note: Statistics based on Filer Branch Address
SAR Filings by ZIP Code 500 to 6,960 (3) 100 to 499 (0) 30 to 99 (5) 10 to 29 (8) 0 to 9 (377) Suspicious Activity Report Geographic Pattern For the State of South Dakota For the Period January 1, 2011 through December 31, 2011 Note: Statistics based on Filer Branch Address
South Dakota Mortgage Loan Fraud SAR Filing Trend For the Period January 1, 2002 through December 31, 2011 Total SARs: 202 Note: Suspicious Activity Report statistical data is continuously updated as additional reports are filed and processed. For this reason, there may be minor discrepancies between the statistical figures contained in this report and those in previous FinCEN reports. Total numbers are calculated by Subjects Address – not filing address.
Added Value Summary Report Spreadsheets For the State of South Dakota For Calendar Years 2010 and 2011 Filings by County Filings by Metropolitan Statistical Area Characterizations by Suspicious Activity Note: Added Value Summary Report Spreadsheets may be accessed by clicking on the hyperlinks. If the spreadsheet does not immediately appear, click a second time.